Wells, A study of the formants of the pure vowels of British English
The physical differences characterizing different speech sounds may be measured in terms of four "dimensions": frequency, amplitude, duration, and spectral distribution. To these correspond the perceptual dimensions of pitch, loudness, length, and tamber or quality [16].
Overall amplitude and fundamental frequency of vowels have not been investigated in the present study. The chief object of interest was spectral distribution; amplitude and frequency have been investigated only insofar as they characterize certain features of it. Vowel duration has also been measured.
The complex sound waves produced by human phonation may be analysed into varying combinations of sine waves characterized by different frequencies and amplitudes.
A speaker's vocal tract acts as an acoustic filter through which the glottal tone of voicing is passed. The glottal tone is composed of a fundamental frequency and its harmonics, with power falling off as frequency increases but present in substantial amounts up to about 3000 cps. As the shape of the vocal tract is altered, so its sound-filtering characteristics are modified. Some frequencies present in the glottal tone are stopped, others are transmitted to a greater or less degree.
While talking, a speaker never holds the shape of his vocal tract constant for more than a moment. The shapes of the supraglottal cavities, and the resonances associated with them, vary almost continuously, as the frequencies stopped or passed change.
A peak of energy at a particular frequency in the output sound corresponds to a passband around that frequency in the filter system of the vocal tract, that is a peak in the filter's frequency response; lack of energy at a particular frequency corresponds to a trough in the frequency response.
The sounds classified, by articulatory criteria, as vowels, are found to be characterized by peaks of energy around the frequencies corresponding to the natural frequencies of the supraglottal cavities as they are during the articulation of the sound concerned; these frequency bands are known as formants. Different vowels are characterized by different formant frequencies, that is by peaks of energy at different frequencies. To the different shapes of the vocal tract and the different positions of the tongue there correspond different frequency responses and passbands, giving rise to vowel sounds with different formants.
One instrument available for the analysis of speech sound waves is the acoustic spectrograph. By means of an electrical filter of variable frequency response it produces a graphic display of a sample of speech known as a spectrogram. Time is shown along one axis and frequency along the other, the amplitude at any point being indicated by the intensity of blackness at that point. A different type of display can also be produced, showing frequency along one axis and the amplitude present along the other, for any particular moment of the sample. This second type of display is known as a section.
In order to be able to specify the vowel sounds of a language in acoustic terms, it is necessary to state, among other things, the frequencies of at least some of the formants characteristic of those vowel sounds. There are, however, certain difficulties inherent in the measurement of vowel formants by means of the spectrograph.
The glottal tone consists almost entirely in energy around the fundamental frequency and around integer multiples of that frequency, that is around its harmonics. Since in the case of a vowel the vocal tract does not add anything to the glottal tone, but rather suppresses parts of it selectively, it is clear that the output sound cannot normally contain energy at any other frequencies save those in the neighbourhood of the fundamental and its harmonics. It was however noticed that in the case of a few of the vowel samples here studies there was apparently a certain amount of anharmonic noise present in the spectrum, particularly around F2.
It may happen that the state of the vocal tract at a particular moment is such that it would pass energy at a certain frequency; but that, since that frequency does not happen to be in the neighbourhood of any of the frequencies present in the glottal tone, there is no energy at that frequency that can be passed. In such a case a spectrogram of the output naturally cannot show the position of the peak of the passband, that is the location of the centre of the formant: all it can show is lesser peaks at the nearest harmonics on either side.
Every speaker varies his fundamental frequency ("the pitch of his voice") while he speaks. Whatever the fundamental frequency, the frequencies of the harmonics are always its integer multiples; if the fundamental rises or falls in frequency, the harmonics rise or fall proportionately more, in geometrical ratio.
Formants have fairly wide bandwidths, the glottal tone being rather highly damped by the supraglottal cavities. Dun [9] concludes that the half-power bandwidths for the first three formants average about 50, 65, and 120 cps respectively.
If the articulatory organs are kept in position while the fundamental is made to rise or fall, the formant, whose centre remains more or less constant, will be manifested as the changing frequencies of the harmonics pass through the formant frequencies. The frequency/time spectrogram will be blackest where a particular formant frequency coincides with the frequency of a particular harmonic, that is, an integer multiple of the fundamental frequency.
The difficulty here is that it is by no means easy to be certain that a speaker is holding his tongue and other organs of speech in the same position while changing the fundamental frequency of his voice. Such a change involves muscular adjustment in the larynx, and it is in the nature of muscular adjustments to be accompanied by slight changes in the adjustment of other muscles in their neighbourhood.
It might be possible to get a more accurate specification of the frequency response of the vocal tract by using an anharmonic input instead of the fundamental-plus-harmonic input of the glottal tone. Such an anharmonic input might be the so-called "glottal whisper". It is, however, by no means certain that the whisper is entirely, or even mainly, produced at the glottis; friction may well occur practically throughout the vocal tract. Meyer-Eppler claims, moreover, [29] that the whispered vowels of German /e i o/, when accompanied by a rising "intonation" (or what would be a rising intonation if voicing were present) exhibit progressively more spectral noise at random frequencies, whereas German /a u/ show changes in the positions of some formants corresponding to rises in intended "pitch". Peterson [34 p.21] found that "there is a tendency for some resonant frequencies to shift upward when a vowel is whispered." Such fundings suggest that analysis of the formants of whispered vowels might well not be applicable to ordinary spoken vowels.
Quite apart from the variations in fundamental frequency corresponding to rises and falls of intonation or voice pitch, there is the further complication that different speakers have different ranges of fundamental frequencies. This is most obviously seen when men's, women's, and children's voices are compared; and equally clearly there are differences within each group: some men have lower voices than others, and so on. And different people have vocal organs of different sizes and shapes, so that the frequency responses of their vocal tract are different. The result of these various factors is that two speakers, speaking the same dialect, may pronounce vowels that sound just the same except for the particular personal quality of each speaker's voice; the vowels would be regarded as identical by the phonetician, but their formants may be at rather different frequencies.
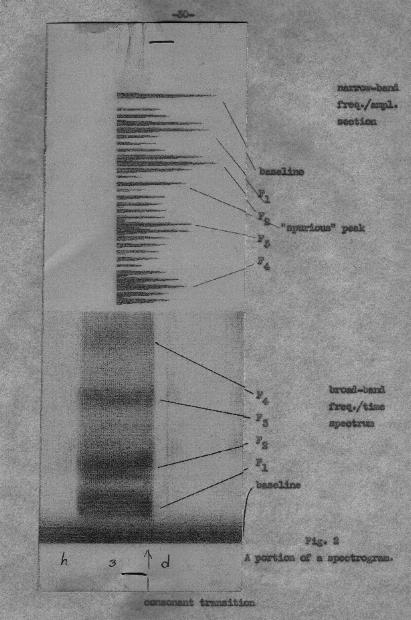
As the input signal is passed through the spectrograph filter over and over again to build up the composite picture of amplitudes, frequencies, and time, the filter deals with only a small range of frequencies at once. The range dealt with depends of course on the bandwidth of the analysing filter. The bandwidths used on the spectrograph employed were 30 and 240 cps: they produce markedly different results. For an average man's voice the narrow (30 cps) bandwidth produces an output showing the individual harmonics of the glottal tone; this means it will show no energy at a formant frequency unless the latter coincides with a harmonic. This will always be the case while the filter bandwidth is less than the fundamental frequency. The wide (240 cps) bandwidth, however, is greater than the fundamental frequency of a man's voice; this means that the individual harmonics are no longer shown on the spectrogram, but that the formant structure becomes more apparent, the periodicity of the vocal source being revealed as a temporal series of fine vertical lines within the various formant bands. (See fig. 2)
Either of these outputs may be examined on the ordinary frequency/time spectrogram, where amplitude is shown by degree of blackness, or on the amplitude/frequency section for a particular instant of the signal, when amplitude is shown more accurately. In either case, the chance relationship of a formant to the harmonics will have a large influence on the output.
It may happen that the resonance curve of the vocal tract is such that the distribution of energy in the regions about the formant peaks is markedly asymmetrical. When the filter bandwidth is much greater than the width of a formant, the latter being in turn greater than the fundamental frequency, the maximum shown on the filter output may be at a frequency not particularly near the true value of the formant peak [36].
The resonance of the analysing filter takes a certain time to build up; this time varies inversely with the bandwidth. With the spectrograph narrow-band analysis, the build-up time is about one-thirtieth of a second (33 millisec.). This finite build-up time creates no difficulties when one is dealing with sustained vowels, but may sometimes do so in the case of sounds in rapid speech.
The question arises, how to measure formant values from a spectrogram. Fig. 1 shows part of a possible narrow-band section of a vowel spectrum. The simplest way would be to take the value of the strongest harmonic shown. This procedure is essentially arbitrary. Clearly the formant centre is really located between the third and fourth harmonics shown in the diagram. Another possibility would be to sketch in an envelope over the harmonic values, and to measure the highest point of this envelope curve. This method depends largely on the skill or luck of the person drawing the envelope; unfortunately envelope curves are not always symmetrical. The envelopes sketched in by different operators can vary considerably [9]. | 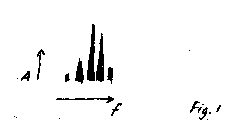
|
Potter and Steinberg [40] developed a method of weighting the amplitudes of the various harmonics in order to derive the central formant frequency. It depends on the relative measured lengths of the various harmonics in the narrow-band section. Peterson [36] considers that this method gives values that are too low; in any case it seems to be of doubtful authenticity [12].
Another weighting technique depends on the use of the psychophysical mol and sone scales [42, 43]. These scales are based on the perception of pure tones, and their validity for complex sounds is questionable.
Abramson [1] describes a method based on the broad-band spectrogram (rather than on a section). A line is drawn by hand on tracing paper down the middle of a formant as the eye judges it. This operation may be carried out several times to reduce gross experimental error. The height of this line above the baseline at a chosen point is then measured, and the results converted into cps. The great advantage of this technique is that in evaluating the formant frequencies at a particular instant it takes fully into account preceding and subsequent values, which no technique based on sections can do.
Best results would appear to be gained by the use of this last technique on a signal of changing fundamental frequency, i.e. said with rising or falling intonation. It is however very time-consuming, and also subjective, in that it depends on the experimenter's eye-judgement, which may well not be reliable.
It was decided to base the frequency measurements in the present study on section spectrograms, using the strongest harmonic in each formant.
With a sustained vowel, if it is kept steady, and given that the voice source does not undergo any marked variation, much the same section and much the same formant values will result, at whatever point in the duration of the vowel the section is made. But sustained vowels constitute an unnatural situation, in that they never occur in speech. It is indeed rare for anything in running speech to remain constant for any appreciable time. A major influence on running-speech formant frequencies is exercised by the preceding and following consonants. Clearly the measurement of a vowel's formants should ideally be made at a point in time where the influence of the preceding consonant has died away and that of the following consonant has not yet appeared. Such a point often does not occur in a vowel of running speech, because the areas of influence of the preceding and following consonants tend to overlap [25, p. 191 ff].
The values of the frequencies of the first two formants alone are not sufficient specification of a vowel. Addition of he third formant makes this rather better, particularly in the case of the front vowels [40].
The relationship of acoustic to articulatory parameters is complex [9, 36, 6]. Very grossly, the first formant rises as the tongue height decreases; the second formant falls as the part of the tongue raised highest changes from front to back. But the shape of the vocal tract is such that its acoustical characteristics are rather complicated. The two basic resonance chambers (pharyngal and buccal) give rise to eight or more formants for some vowels. It is impossible, however, that all of such a large number of formants can be individually significant. "There is every reason to believe that all of the physical details of vowels are not equally significant in their function. Those parameters which are significant may of course vary from one language to another. To assume that all details of vowel stimuli are controlled equally well, however, is to assume a generation of information (in the mathematical sense) which is far greater than that of whuch the human organism is capable." [35]
As mentioned earlier, men, women, and children have vocal tracts of markedly different sizes, so that naturally their formants are different. Yet we identify a child's vowels correctly in spite of this. An /i/ said by a man and an /i/ said by a woman are felt to be "the same sound" and are equated, as far as phonetic quality goes, by the phonetician. On the usual F1/F2 plot they have quite different positions, but on an "articulatory" vowel-diagram they have the same position. Peterson has suggested that [35] a more realistic acoustic diagram is achieved by plotting the ratio of F1 to F3 along the vertical axis and the ratio of F2 to F3 along the horizontal axis, all values being expressed in mels. Then men's, women's and children's "same" vowels are claimed to come out with approximately the same positions.
On the other hand, it seems to have been conclusively shown by Ladefoged and Broadbent [26] that a listener relates every vowel he hears to what he has perceived as the speaker's personal range of vowel variation, rather than to any absolute formant values. An /e/ is identified as such not because of a particular ratio of F1 to F2 or of mel-scale F1/F3 to F2/F3, but because its formants lie at a particular point in the interval between the observed values of the extremes manifested in /i/ and /ɑ/. This is only to be expected in view of the fact that it is a linguistic activity that is under investigation, and all linguistic activities are relative rather than absolute.
The perceived pitch of a formant, as opposed to its physical frequency, also appears to be influenced by its amplitude and by the pitch of the fundamental [31; 25, p. 25]. Indeed, pitch, loudness, voice quality and phonetic quality are all interdependent [36].
The role of the third and higher formants seems to be mainly non-linguistic as far as English is concerned; F3 is important as an acoustic correlate of retroflexion and nasalization [6], while the higher formants certainly contribute to distinctive personal voice quality and also increase the redundancy, and therefore the intelligibility, of the speech signal. [33] Trained singers have well-defined higher formants, and also well-defined valleys between them; these appear to be responsible for increased over-all richness, sonority, and carrying-power.
Flanagan [13, 14] has done work on determining the difference limina for vowel formant frequencies and the accuracy necessary in quantizion of vowel parameter data. He finds that the frequency of F1 should be specified to the nearest 20 cps, and its amplitude to the nearest decibel; for F2 the figures are 50 cps and 3 dB, and for F3 75 cps and 5 dB. That these are considerably narrower limits than the standard deviation figures established in the present study is hardly surprising, since Flanagan was concerned to find the smallest change which made the vowel tamber change perceptibly, and this is of course much less variation than is to be expected within the range of a given vowel phoneme. Flanagan's figures imply that on a basis of comparison there are upwards of thirty thousand perceptibly different vowel tambers.
To be really valid, studies of linguistic phenomena must be based upon a large number of speakers -- in general, the more speakers of a given language or dialect are studied, the more comprehensive the results, and the more certainly will one be able to predict the speech behaviour of the remaining members of the linguistic group concerned. It is therefore somewhat surprising that so few of the spectrographic analyses of speech features so far published are based upon more than a handful of speakers.
Apart from the pioneering study of American English vowels by Peterson and Barney [37], the only piece of work known to me which could be claimed to have any statistical significance is Fant's study of Swedish vowels [10]. Other studies are based upon the speech of only a very small number of speakers: e.g. studies of Russian [4, 24, 30], Japanese [8, 45], French [3], and Spanish [41]. Even these, of course, pertain to vowels in isolated test words or in sustained form; detailed spectrum data from connected speech are not anywhere evident [44].
A vowel which is perceived by a hearer whose ear has been adequately trained to be of the same tamber throughout may be defined as monophthongal (or "pure"), while a vowel perceived to be of changing tamber by such a hearer may be defined as diphthongal (or triphthongal, etc., as the case may be).
In some forms of RP English (for this term, see ch. 2) there are perhaps no stressed vowels which are phonetically monophthongal. Speakers of this type of English usually have centring diphthongs for the vowel phonemes /ɩ ɛ æ ɒ ɷ ʌ/ -- which are therefore realised phonetically somewhat as [ɩə̆ ɛə̆ æə̆ ɒə̆ ɷə̆ ɐə̆] -- although the centring glide is not as marked as that heard in the realization of the phonemes /ɩə ɛə ɷə/ (and /ɔə/, if the speaker has this phoneme in his idiolect). [23, p. 35]. Of the long vowels, /i u/ are quite commonly diphthongs of the type [ɩi, ɷu], while /ɑ ɔ ɜ/ may have centring glides at the end, although this last feature does not appear to be of frequent occurrence.
In some other forms of RP, there are many more virtually monophthongal vowels than would appear from current transcriptions. In particular, the phonemes /ɩə ɛə ɷə/ (and, if used, /ɔə/) may be realised -- at least in certain phonetic contexts -- as long monophthongs of the type [ɩː ɛ̈ː ɷː (ɔː)]; while /eɩ oɷ/ may be long monophthongs around [ęː, ëː]. The monophthongization of the so-called triphthongs /aɩə, aɷə/ to monophthongs somewhere between [aː] and [ɑː] is extremely common. /aɩ aɷ ɔɩ/ do not appear to have monophthongal variants in RP.
From the purely phonetic point of view, then, it does not seem to be possible to divide RP vowels into monophthongs and diphthongs with any certainty.
For practical purposes, however, there can be no doubt that the vowels chosen for the present study -- viz. /i ɩ ɛ æ ɒ ɔ ɷ ʌ ɜ/ -- are generally much more monophthongal than the remaining syllabic nuclei; and none of the speakers whose pronunciation was here studied did in fact diphthongize these vowels very noticeably, with the occasional exception of /i/ and /u/.
The term "pure vowels" in the title of this dissertation may therefore be taken to mean the vowels numbered one to eleven by Jones [21 etc.], which are usually more or less monophthongal.
I cannot accept Jones's view that such pairs of vowels as ɩ-i constitute two allophones of the same phoneme, their occurrence being conditioned by the presence of one or another "chroneme"; I have therefore treated ɩ and i, and other such pairs, as separate phonemes, and written them as such between slants //. Such an analysis is not, however, the only acceptable phonemic analysis of RP syllabic nuclei: in particular, the long vowel i may be regarded as a sequence of the short ɩ and a glide /j/ (as initially in yes), and all other "long" vowels and diphthongs similarly analysed into two elements, a short vowel and a glide [46].
The "neutral vowel", /ə/, has not been studied here. It does not normally occur stressed in careful speech, and is particularly difficult to elicit from speakers in stressed monosyllables. It is also known to have a very wide allophonic range [21, §355ff].
The vowels studied are, basically, phonetically like those described in well-known textbooks of English phonetics like Jones [21]. Certain recent developments in RP vowels do, however, deserve mention.
/ɔ/ is nowadays usually a much closer vowel, having a tongue-raising somewhere between "half-open" and "half-close", rather than the "half-open" to "open" position described by Jones. There is close lip-rounding, rather than the open rounding described by Jones; but the jaw opening is still rather wide, giving the characteristic "over-rounded" tamber of the sound. This closer /ɔ/ is by now rather general, and cannot be called a London regional characteristic, as implied by Jones [23, §108].
/u/ is sometimes rather centralized, as well as being, like /i/, sometimes rather markedly diphthongal. One or two occurrences of /ɷ/, too, were even more centralized than one would expect, approaching the position [ɵ].
/ʌ/ is usually very much fronter than the position described by Jones. Only one speaker has an /ʌ/ like Jones's; the rest had a half-open to open tongue position varying from about central nearly to cardinal [a].
/ɜ/ seemed on the average a bit opener than the nearly half-close position described by Jones.
Other vowels which have recently undergone phonetic modification, such as the diphthong Jones writes ou, were not covered in the present study.
It should be pointed out that only one allophone of each phoneme has been studied here, namely that allophone occurring under nuclear stress after /h/ and before /d/. Other stressed allophones do not appear to differ substantially, except sometimes the allophones occurring before /l/.