

Abstract
Our previous work has shown the perceptual benefits of enhancing
specific regions of natural VCV and sentence materials. The work
reported here tests the extent to which these enhancements improve
intelligibility for a range of different speakers. VCV tokens
produced by two female and two male speakers without phonetic
training were annotated to highlight the vowel onset/offset and
consonantal constriction/occlusion regions. These regions were
then selectively amplified to enhance the cues they contained,
then combined with speech-shaped noise at 0 dB SNR and presented
to normally-hearing listeners. Improvements in intelligibility
as a result were found for all speakers although the extent of
the improvement varied greatly between them. The possible origins
of these differences are discussed.
1. Introduction
Two different approaches can be taken to increasing the intelligibility
of speech in noise: one is to reduce the effects of noise on speech
after contamination has taken place. The other is to process
speech before contamination so as to make it more able
to survive the competing noise. The second approach has often
been adopted in studies which seek to improve speech intelligibility
in hearing-impaired listeners (e.g., Gordon-Salant, 1986; Montgomery
and Edge, 1988). This approach of enhancing key acoustic features
in clean speech was also taken in our study with the aim of improving
speech perception in adverse conditions for listeners with normal
hearing.
The choice of acoustic cues to enhance was influenced by several findings. Research on how speakers change their speech when communicating in background noise shows systematic changes in encoding phonetic contrasts (e.g. Lane and Tranel, 1971). In plosives, for example, stop gaps are longer, formant transitions longer, and bursts more intense. Mimicking some of these effects has been shown to improve the intelligibility of a speech signal (Gordon-Salant, 1986). Additional insight comes from work on the characteristics of a 'clear' speaking style (e.g., Picheny, Durlach and Braida, 1986). These included an increase in consonant and vowel duration and in consonant/vowel intensity ratio. Finally, another source of information is the relative importance of different acoustic cues used by listeners when perceiving phonetic contrasts. For example, Hazan and Rosen (1991) investigated individual differences in the perceptual weight given to acoustic cues when perceiving stop consonants. They found that some acoustic cues were 'robust' in the sense that they were used by a great majority of listeners.
Hazan and Simpson (1996) looked at the intelligibility of consonants presented in a nonsense VCV structure and semantically unpredictable sentences (SUS) and annotated acoustic cues in information-rich regions of the signals. These regions comprised the vowel onset/offset segments which contained formant transitions at the formation and release of the constriction/occlusion, and the cues at release of or during the constriction/occlusion (friction, nasal murmur, burst and aspiration). Formant transition cues were amplified to counteract the reduction in amplitude near the constriction, the weakest voicing cycles being given the most amplification. Occlusion/constriction cues were also amplified to increase their salience. When stimuli manipulated in this way were presented in speech-shaped noise at 0 dB SNR to normally-hearing listeners, consonant identification accuracy increased by around 10% compared with unaltered stimuli.
In this work, enhancements were carried out on material obtained from a single phonetically-trained male speaker. It is well known that speakers may vary greatly in intelligibility and many studies have investigated factors which may explain why certain speakers are more intelligible than others. For example, Bradlow, Torretta and Pisoni (1996) investigated a number of speaker characteristics using a database containing sentence material for 20 speakers. They found that female speakers were generally more intelligible than men, that speakers with large vowel spaces showed higher intelligibility scores than those with small vowel spaces and that certain types of errors could be related to timing characteristics of the speech signal.
In order to show that our enhancement techniques are robust, it is essential to demonstrate that they can lead to improved intelligibility for a range of speakers, both male and female. As phonetic training is also a factor which may lead to greater clarity of production, it is also essential to demonstrate an effect of enhancement with speakers who have received no such training. To this end, a set of 2 male and 2 female speakers were selected. A further aim was to investigate whether there would be any relation between the general level of intelligibility for each speaker and the extent of the enhancement effect. Finally, we wished to investigate whether the error patterns seen would be similar across speakers and whether they might be related to acoustic-phonetic characteristics of the talkers' speech.
2. Method
2.1 Test materials
2 instances of each of 36 vowel-consonant-vowel (VCV) stimuli
comprising the consonants /b,d,g,p,t,k,f,v,s,z,m,n/ in the context of the vowels
/a,i,u/ were recorded from 4 speakers.
The speakers were aged between 25 and 30 years old, 2 were male
(MH, MS), 2 were female (AO, DJ) and none had received any phonetic
training. Speakers AO, DJ, and MS had south-eastern British English
accents; speaker MH's accent was north-eastern but slight; all
speakers had British English as their first and dominant language.
Stimuli were recorded in an anechoic room and were digitised at
a 16 kHz sampling rate with 16-bit amplitude quantisation. Digitised
stimuli were then annotated using a waveform editing tool to mark
the regions for amplification.
When selecting and annotating regions containing the acoustic cues to be enhanced, a distinction was made between the transition regions between vowel and consonant, and the consonantal constriction/occlusion regions, i.e. the burst transient, burst and aspiration, friction or nasality regions.
For the transition regions, the reduced amplitude as the consonant constriction/occlusion was formed or released was counteracted by progressively amplifying the final five cycles of the first vowel, or the initial five cycles of the second vowel, by between 1 and 4 dB. For the constriction/occlusion regions, the corresponding aspiration, friction or nasality cues were amplified by 6 dB and the burst release region in plosives was amplified by 12 dB.
Stimuli were annotated to pinpoint the above regions, and the amplification applied digitally by scaling the regions' sample values. To avoid waveform discontinuities at region boundaries due to an increase in amplitude of a region relative to its neighbours, 5 ms raised-cosine ramps were used to blend adjoining sections together.
After manipulation, stimuli were combined with noise which had the same spectral envelope as the long-term average spectrum of speech. The noise conformed to CCITT Rec. G227 and was produced by a Wandel and Goltermann RG-1 noise generator. A signal-to-noise ratio of 0 dB was calculated on a stimulus by stimulus basis and took into account any change in the amplitude of the stimulus produced as a result of enhancement. The noise started 200 ms before the onset of the first vowel and lasted 1.5 s, to ensure that all stimuli had the same duration after contamination. The noise was tapered using raised cosine ramps 100 ms in duration at the start and end of each stimulus.
2.2 Listeners and test procedure
14 listeners took part in the experiment. All were aged between
20 and 30 years, had British English as their first and dominant
language, and had hearing thresholds <= 20 dB HL in the range
125 Hz - 8 kHz. Listeners took part in two sessions, each lasting
an hour, and were paid for their participation.
Stimuli were presented binaurally at a comfortable listening level in a sound-proof room through Sennheiser HD414 headphones. The experiment was controlled by a computer program which presented each stimulus only once and then required listeners to identify the consonant heard by selecting with a mouse-controlled cursor one of twelve consonant symbols displayed on a computer monitor.
Listeners heard 3 repetitions of a natural and corresponding enhanced version of each of 2 different tokens of each of the 36 VCVs spoken by each of the four speakers. Stimulus presentation order was completely randomised. Listeners had received 10 minutes of familiarisation with the task before starting the experiment.
3. Results
3.1 Speaker effect on consonant intelligibility
Overall identification scores are shown in Figure 1. Intelligibility
scores for unaltered stimuli ranged from 61% (Speaker MH) to 83%
(Speaker DJ). The mean improvement in intelligibility scores as
a result of enhancement was 9%, and the range was from 5% (DJ)
to 19% (MH). In Figure 1, it can be seen that the difference
in consonant intelligibility between the least and most intelligible
speakers was 23 % for the unenhanced consonant but only 8% for
the enhanced stimuli as a result of a much greater effect of enhancement
for the originally less intelligible speaker. It is also noteworthy
that the highest two scores were obtained for the female speakers
and lowest two for the male speakers.
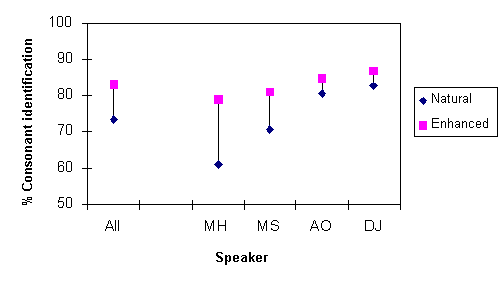
Figure 1. Identification accuracy versus condition for all speakers
Analyses of Variance revealed that there was a significant effect of condition (natural vs enhanced) (F=295.38, DF=1, p<0.0001), speaker (F=166.71,DF=3,p<0.0001), and an interaction between speaker and condition (F=37.14,DF=3,p<0.0001). Duncan's multiple range post-hoc test showed that each of the speakers differed significantly from all others.
Analyses of variance were then carried out separately on the data obtained for each speaker to evaluate the main effects of condition, vowel context and token (two different tokens presented for each VCV). For all four speakers, the effect of condition was significant at the 0.001 level, with higher intelligibility scores obtained for the enhanced condition. For all four speakers, the effect of vowel context was significant at the same level. The effect of token was weakly significant (p=0.026) for Speaker DJ but non-significant for the other three speakers.
3.2 Effect of enhancement on consonant intelligibility
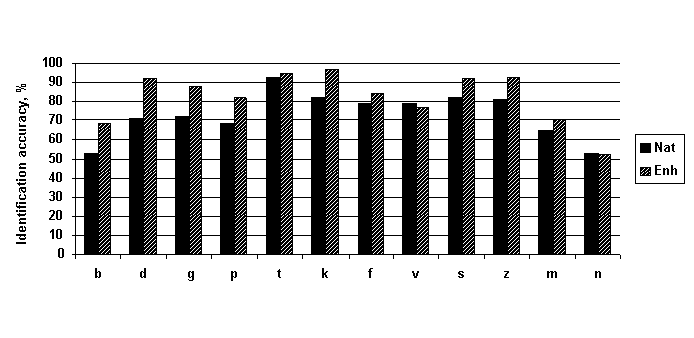
Figure 2 shows the intelligibility scores for each of the 12 consonants
averaged over all speakers and all vowel contexts. The benefits
of enhancement are most noticeable for the plosive consonants,
particularly for /d/ as its mean identification accuracy improved
from 71% to 92% after manipulation. For the non-sibilant fricatives
(/f,v/) and the nasals (/m,n/), the effects of enhancement appeared
to be slight or non-existent.
A more detailed analysis of the effect of enhancement can be achieved by evaluating its effect on the correct identification of the phonetic features (voicing, manner and place or articulation) signalled by the acoustic patterns that were enhanced. Information Transfer analyses (Miller and Nicely, 1955; Wang and Bilger, 1973) were carried out in order to determine how well these features were identified in the natural and enhanced conditions.
Analyses of variance were carried out on the information transfer scores for each feature. The effect of test condition (natural vs enhanced) was significant at the .0001 level for all three features in the expected direction.
3.3 Error patterns across speakers
Next, the speaker effect, which was found to be significant for
the overall intelligibility scores, was investigated in more detail.
First, analyses of variance were applied to the information transfer
scores obtained above separately for each feature to evaluate
the main effect of speaker (see Figure 3).
For place of articulation scores, the effect of speaker was strongly significant [F3, 39)=109.77; p<0.0001] and Duncan's post-hoc multiple range test revealed that the scores for all speakers differed significantly from each other. For the manner of articulation feature, the effect of speaker [F3, 39)=97.09; p<0.0001] was significant; scores for speaker DJ were significantly higher than other speakers and scores for speaker MH significantly lower than the other three speakers. For the voicing feature, the speaker effect was also significant [F3, 39)=34.28; p<0.0001] the post-hoc test showed that the scores for female speakers did not differ from each other but were signifcantly higher than those for speaker MH who obtained higher scores than speaker MS.
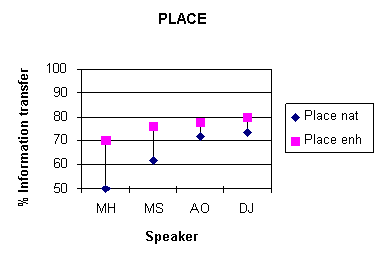
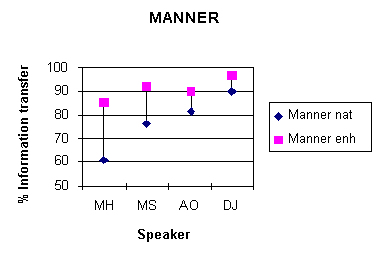
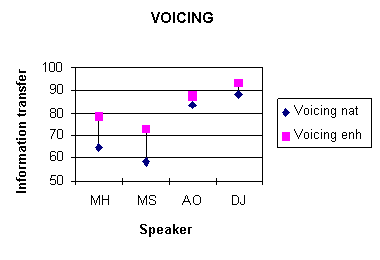
Figure 3. Mean information transfer
scores for the features of place of articulation, manner of articulation
and voicing for each of the four speakers in the natural condition.
Individual consonant identification was also examined to see whether particular consonants contributed to the difference in overall intelligibility per speaker. The analysis centered on a comparison between the most (DJ) and least (MH) intelligible speaker.
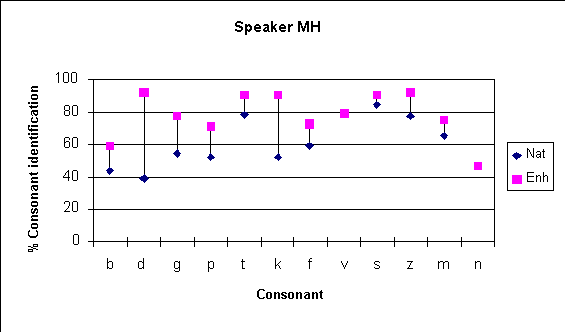
Figure 4. Speaker MH: Identification accuracy versus consonant
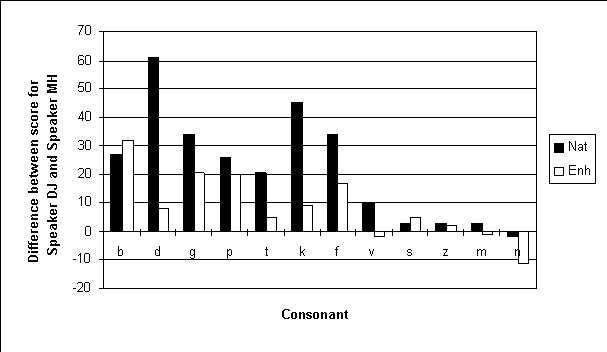
Figure 5: Difference in intelligibility scores between
the most (Speaker DJ) and least (Speaker MH) intelligible speakers.
Consonant identification scores for Speaker MH are presented in Figure 4 and a bar chart showing the difference in scores per consonant between the most and least intelligible speakers is presented in Figure 5. In the natural condition, the greatest difference in scores between the two speakers was found for the plosives and the non-sibilant fricative /f/. The score differentials for these sounds were generally reduced in the enhanced condition. For the nasal consonants, the score difference between the two speakers was less than 10%.1
A closer analysis of speaker differences was made by analysing the error patterns seen on the confusion matrices obtained for each speaker. A small number of confusions were common to the speech material obtained for all speakers. The most common was the /m/-/n/ confusion (/m/ perceived as /n/ and vice-versa), /p/ perceived as /k/ and /b/ perceived as /v/. Other consonant confusions were more speaker-specific. Voiced plosives produced by both male speakers were poorly recognised: in Speaker MH, they were confused with each other (errors in place of articulation) whilst in Speaker MS they were confused with each other but also with their voiceless counterparts.
3.4 Acoustic-phonetic characteristics of speakers' productions
Numerous studies have seeked to find acoustic-phonetic characteristics
which may be correlated to consonant intelligibility (e.g. Dubno
and Levitt, 1981) and to differences in intelligibility between
speakers (e.g., Bond and Moore, 1994). Most recently, Bradlow
et al (1996) investigated the speaker effect on sentence intelligibility
using a database of 100 sentences produced by 20 speakers. Our
data is much more restricted both in terms of the number of speakers
analysed and in terms of the structure of the material. Nevertheless,
it seemed of interest to examine some of the acoustic-phonetic
characteristics that were most promising in the Bradlow et al.
study to see whether they might appear to correlate with speaker
intelligibility.
First, an analysis was made of the vowel space for each of the speakers. Measures reflecting vowel space which correlated best with sentence intelligibility in the Bradlow et al. (1966) study were the range covered by F1 across point vowels and measures of F2-F1 distance for the point vowels /a/ and /i/. Formant frequencies were measured using the SFS speech analysis software. Measurements were made from the second vowel with the cursor placed at the centre of the relatively steady-state region, i.e. after consonantal formant transitions had taken place, but before phonation began to fade away. Measurements were made for two different productions of five tokens from the data set for each speaker with the vowel in the context of consonants /d,f,m,t,z/ (i.e. 10 measurements per vowel per speaker). First and second formant frequencies were estimated manually from the spectrum of a single cycle in the target region using the spectrographic display to confirm estimates of formant location. The frequency measures obtained were transformed to an auditory frequency scale -- the ERB (equivalent rectangular bandwidth) scale (Glasberg and Moore, 1990).
in F1 | in F2 | distance /i/ | distance /a/ | ||
The difference in F1 and F2 between the point vowels /a/ and /i/ was calculated for the four speakers. The F1 range appeared to be generally larger in the two male speakers but the F2 range was larger for the female speakers. The F1/F2 distance measures for /a/ and /i/ suggested a more expanded vowel space in the male speakers as they showed more expanded F1/F2 spacing for /i/ and more compact F1/F2 spacing for /a/ than the female speakers. On the basis of this limited set of data, there seemed therefore to be little correlation between vowel space and intelligibility.
Another acoustic feature which is characteristic of clear speech is a high consonant/vowel ratio. In order to investigate the possible relation between consonant intelligibility and CV ratio in the natural tokens, CV ratio measurements were made by calculating the rms energy in the consonantal region and in the second vowel then the ratio of consonant to vowel energy. 24 measurements were obtained for each consonant (4 speakers*2 tokens*3 vocalic contexts). CV ratios are presented separately in Table 2 for the male and female speakers. There appears to be a difference between ratios for male and female speakers for the plosives, with females producing less intense burst+aspiration regions relative to the vowel. For each consonant, the strength of correlation between the CV ratio (all speakers) and intelligibility for unenhanced stimuli was calculated (See Table 2). A significant correlation was only obtained for 4 out of the 12 consonants (/d,k,v,n/). The correlations obtained were not in the expected direction as in three of the cases higher intelligibility scores were correlated with high negative CV ratios (i.e. less intense consonant regions). On closer examination, it appears that this was due to the consonants produced by the female speakers being more intelligible although of lower intensity relative to the following vowel.
| Consonant | CV ratio males (dB) | CV ratio females
(dB) | Correlation between CVratio and nat score | |
| b | -6.69 | -10.72 | 0.18 | |
| d | -6.76 | -9.38 | -0.56 | ** |
| g | -6.81 | -11.13 | -0.10 | |
| p | -10.88 | -13.67 | 0.11 | |
| t | -10.25 | -9.70 | 0.33 | |
| k | -9.18 | -10.71 | -0.56 | ** |
| f | -12.78 | -15.27 | 0.15 | |
| v | -10.15 | -7.55 | 0.52 | ** |
| s | -12.48 | -12.92 | 0.39 | |
| z | -5.57 | -5.29 | 0.37 | |
| m | 2.70 | 4.45 | -0.12 | |
| n | 2.52 | 3.77 | -0.58 | ** |
Table 2. Mean consonant-vowel ratios for individual consonants produced by male and female speakers (12 tokens per mean value).The third column shows correlations between CV ratio and intelligibility of natural stimuli over all speakers. ** indicates a significant correlation at .01 level for df=22.
Finally, it must be considered whether the speaker difference obtained might be at least partly a function of the type of noise masking used. Indeed, a difference in the energy distribution in male and female voices might affect the degree to which the noise masked the signal. A long-term spectrum was calculated for each of the four speakers by aggregating the signals for all VCV tokens (unenhanced condition) for a speaker. This was superimposed on the long-term spectrum of the noise (see Figure 6). A difference can be seen between the spectra for the two male and two female speakers in the high frequency region (6-8 kHz) where there appears to be much greater energy in the speech produced by female speakers. A closer examination of individual spectrograms suggest that this is due to greater energy in this region in the vowel sounds produced by the female speakers. It is therefore not incompatible with the generally lower CV ratios described above. Though it does appear that the noise was potentially a more effective masker for the tokens produced by male speakers, this is unlikely to be the sole factor in the difference between the intelligibility of male and female speakers as such a difference was also found in Bradlow et al (1996) with speech material presented in clear.
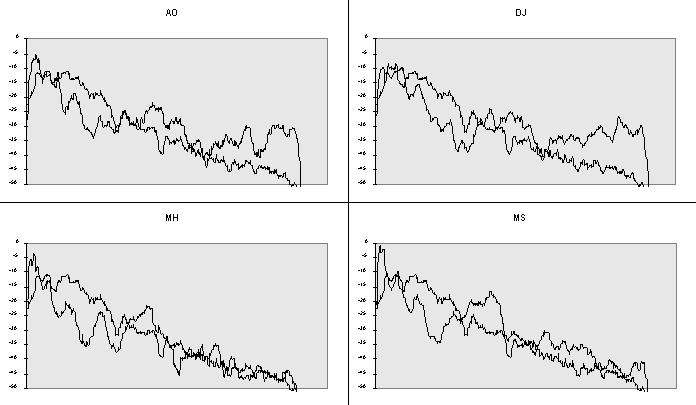
Figure 7. 'Long-term spectrum of aggregated natural speech tokens per speaker (dark line) superimposed on the long-term spectrum of the noise masker (light line).
4. Discussion
Previous work had shown that the cue-enhancement techniques described
in Hazan and Simpson (1996; in press) were successful in improving
consonant intelligibility in noise for speech material produced
by a single phonetically-trained male speaker. These results have
now been replicated with four untrained speakers, 2 male and 2
female. Although the effect of the enhancement varied across speakers,
the difference between natural and enhanced scores was significant
for each .
There appeared to be an inverse correlation between the effect of enhancement and the intelligibility score obtained for unenhanced stimuli: the lower the initial score, the greater the effect of enhancement. This had the result of levelling out the intelligibility scores obtained for the enhanced stimuli (range of 8% across speakers vs 23% for unenhanced stimuli). The enhancements were most effective in increasing the intelligibility of plosive consonants.
Some acoustic-phonetic characteristics of the speech were examined to look for possible correlations with speaker intelligibility. These exploratory measures yielded few significant results. This may come as little surprise given that similar measures carried out on much larger databases yielded rather weak correlations. An area for further investigation is the relation between the long-term spectral characteristics of a speaker's speech and the spectral characteristics of the noise masker. This could be examined for example by calculating measures of consonant-to-noise ratio or noise crossover frequency as proposed by Dubno and Levitt (1981).
A speaker effect was found in the patterns of consonant confusions. An analysis of confusion matrices revealed that certain consonant confusions were fairly 'universal' in that they occurred in all four speakers. An example of this is the /m/-/n/ confusion, and there is little evidence that the enhancement techniques applied have been very successful in disambiguating this confusion. Such a finding therefore points to the need for some refinement of the enhancement strategies applied to nasal consonants. Other consonant confusions appeared to be more idiosyncratic: for example voiced plosives by Speaker MS were often perceived as voiceless, but not a single error of this sort was made for Speaker DJ.
In conclusion, these results confirm the success of our enhancement techniques in increasing speech intelligibility for different levels of clarity of the natural speech. Even though the extent of the effect of enhancement was speaker-dependent, the fact that the effect was statistically significant for all speakers tested so far is encouraging.
Speaker effects are of serious concern in speech technology applications as they can affect the efficacy of speech recognition, noise reduction and speech transmission systems. Here, differences in intelligibility across speakers appear to have been reduced in the enhanced condition. These results are therefore encouraging as regards the future practical application of such techniques.
Acknowledgements
This work was funded by an EPSRC project grant (GR/L25639). We
thank Stuart Rosen for his helpful comments on a previous version
of this paper.
References
Bond , Z.S. and Moore, T.J. (1994) A note on the acoustic-phonetic
characteristics of inavertently clear speech. Speech Communication,
14, 325-227.
Bradlow, A.R., Torretta G.M. and Pisoni, D.B. (1996) Intelligibility of normal speech I: Global and fine-grained acoustic-phonetic talker characteristics. Speech Communication, 20, 255-272.
Dubno, J.R. and Levitt, H. (1981) Predicting consonant confusions from acoustic analysis. Journal of the Acoustical Society of America, 69, 249-261.
Glasberg, B. R., and Moore, B. C. J. (1990). Derivation of auditory filter shapes from notched-noise data. Journal of Experimental Hearing Research, 47, 103-138.
Gordon-Salant, S. (1986) Recognition of natural and time/intensity altered Cvs by young and elderly subjects with normal hearing. Journal of the Acoustical Society of America, 80, 1599-1607.
Hazan, V. & Rosen, S. (1991).Individual variability in the perception of cues to place contrasts in initial stops. Perception and Psychophysics, 49, 187-200.
Hazan, V. and Simpson, A. (1996) Cue-enhancement strategies for natural VCV and sentence materials presented in noise. Speech, Hearing and Language: Work in Progress, UCL, vol. 9, 43-55.
Hazan, V. and Simpson, A. (in press) The effect of cue-enhancement on the intelligibility of nonsense word and sentence materials presented in noise. Speech Communication. vol. 24 (3).
Lane, H.L. and Tranel, B. (1971) The Lombard sign and the role of hearing in speech. Journal of Speech and Hearing Research, vol. 14, pp. 677-709.
Miller, G.A. and Nicely, P.E. (1955) Analysis of perceptual confusions among some English consonants. Journal of the Acoustical Society of America, 27, 338-353.
Montgomery, A.A. and Edge, R.A. (1988) Evaluation of two speech enhancement techniques to improve intelligibility for hearing impaired adults. Journal of Speech and Hearing Research, 31, 386-393.
Picheny, M.A., Durlach, N.I. and Braida, L.D. (1986) Speaking clearly for the hard of hearing II: Acoustic characteristics of clear and conversational speech. Journal of Speech and Hearing Research, vol. 29, pp. 434-446.
Wang, D.M. and Bilger, R.C. (1973) Consonant confusions in noise: a study of perceptual features. Journal of the Acoustical Society of America, 54, 1248-1266.
© Andrew Simpson and Valerie Hazan
 for comments