

Abstract
Bandwidth is one spectrally contrastive feature of voiceless speech
that could be used in a low-frequency speech recoding scheme for
hearing-impaired people. This study examines the bandwidth discrimination
ability of severe-to-profoundly hearing-impaired listeners for
low-frequency bands of noise. Task 1 investigated the discrimination
of bandwidth for noises symmetrical around a 300-Hz centre frequency.
Two conditions were used, in which the wider or the narrower
of two bandwidths was fixed, and the other was varied. The wide
fixed bandwidth was 500 Hz, and the narrow fixed bandwidth was
124 Hz. Psychometric functions were measured and fitted by Probit
analysis to the logarithm of bandwidth ratio. All subjects were
capable to some extent of discriminating bandwidth. 75% correct
bandwidth ratios for the hearing-impaired group ranged from 1.32
to 2.91. Threshold bandwidth ratios for normally hearing subjects
ranged from 1.16 to 1.74.
In a second task the estimated threshold from Task 1 was used as a reference point to examine whether performance was affected by eliminating either the upper or the lower frequency differences between the stimuli. The results showed that subjects tended to use high frequency edge cues to discriminate the noises when the wide noise band was fixed at 500Hz. When the narrow noise band was fixed at 124 Hz, individual subjects relied on different cues to discriminate the stimuli.
1. Introduction
The work described in this paper is aimed at determining the potential
for encoding the spectra of voiceless fricatives for severe-to-profoundly
hearing-impaired listeners. A practical objective is to describe
a region of hearing in these listeners in which the main spectral
features of fricatives could potentially be encoded.
It is well known that severe and profoundly hearing-impaired listeners experience problems in understanding speech, particularly in noisy environments. These difficulties arise mainly due to their limited frequency and dynamic range and also from the loss of much of their spectral analytic abilities (e.g. Rosen et al.,1990; Faulkner et al., 1992). These limited abilities mean that many of the acoustic cues essential for speech perception are not available. Many profoundly hearing-impaired listeners cannot use the cues associated with formant structure and transitions. In addition, the high-frequency aperiodic cues important for manner and place distinctions amongst plosive and fricative consonants are lost. Hence these listeners are largely dependent on lip-reading for the perception of these speech contrasts.
Many of these listeners receive useful lip-reading support from conventional amplifying hearing aids, largely from the low-frequency temporal information representing the voicing pattern, fundamental frequency, and amplitude variations. However, psychoacoustic studies have shown that the majority of profoundly hearing impaired people retain potentially useful auditory abilities which are not fully exploited by conventional amplification, and which could be utilised to extend the range of speech information which is perceived by these listeners. Amongst these residual abilities are:
1) significant frequency selectivity in frequency regions of less profound hearing loss (Faulkner et al., 1990);
2) the ability to distinguish between periodic and aperiodic stimuli with a similar frequency content (Rosen et al., 1990);
3) relatively good resolution of amplitude modulations of low-frequency
carrier signals at modulation rates of 80 Hz and below (Faulkner
and Rosen, 1990).
The SiVo hearing aid (Rosen et al., 1987) was developed to allow profoundly hearing impaired listeners to utilise these residual auditory abilities to improve speech perception. The aid is based in the speech pattern element approach (Fourcin 1977). The objective is to select those elements that are most useful for speech perception so as to simplify the speech signal. The elements provided depend on the individual's hearing abilities and are matched to the individual frequency and intensity range. The first implementation of the speech pattern element approach (SiVo-1) represented the voice fundamental frequency as an acoustic sinusoid.
Results with this version of the SiVo aid proved to be promising, with subjects showing improvements in their perception of voicing contrasts and intonation (Faulkner et al., 1992). Additional features have since been added to the SiVo aid. These include speech amplitude envelope and voiceless frication information. Amplitude envelope information is intended to convey loudness variations, which carry suprasegmental cues, and to enhance the perception of some manner and voicing contrasts. Voiceless excitation information provides an audible indicator of the presence of frication to assist with the perception of voiceless fricative and plosive consonants. Laboratory evaluations with English listeners (Faulkner et al., 1992) and Chinese listeners (Wei, 1993) have given promising results for some subjects, due to the addition of extra features providing more speech information. However many subjects with a severe or profound hearing loss still gain more information from a conventional aid than from the SiVo with this limited set of features. It is therefore necessary to increase the number of features on the SiVo to assess if a larger number of simplified features may help with speech perception.
1.1 Simplified representations of voiceless frication
The aim of this work is to simplify the spectra of voiceless fricatives
and provide them as a low-frequency noise. There are two essential
aspects to the development of such encoding - 1) to discover the
basic perceptual limitations of the listeners, and 2) to identify
the most important acoustic cues for consonant identification.
The latter issue has received some attention from other workers.
Harris (1958) carried out an experiment with normally hearing
listeners where she spliced and recombined vocalic and frication
sections from 16 CV syllables. In a perceptual test to determine
the importance of the vocalic and frication components, she found
that the sibilant/non-sibilant classification was based upon the
intensity of the frication. The identification of the individual
sibilants  was determined by the main frequency peak of the frication and
the distinction between the non-sibilants
  was based upon the pattern of vowel formant transitions.
Heinz and Stevens (1961) synthesised a set of fricative stimuli
with a range of centre frequencies (from 2 to 8 kHz) and bandwidths.
They found that for normally hearing subjects there was little
effect of bandwidth but there was an effect of centre frequency.
As centre frequency increased, responses changed from  to [ç] to [s]
to
  . The
addition of a low-frequency noise to the high-frequency stimuli
(centre frequencies of 6.5 and 8 kHz) improved the perception
of the non-sibilants.
Although we have information about which acoustic cues should be considered when encoding the voiceless fricatives, we cannot apply this information to hearing- impaired listeners until we understand more about their perceptual abilities for discriminating noise-like stimuli within the low frequency region of their hearing.
1.2 Noise centre-frequency discrimination
Vickers and Faulkner (1993; 1996) described the results of an
experiment with profoundly hearing-impaired listeners where spectrally
adjacent bands of noise were discriminated at different frequencies
and different bandwidths. The stimuli were fixed in bandwidth
and frequency within a run and the duration was adaptively altered.
A criterion duration for useful discrimination of 80 ms was chosen
because it is the shortest duration of fricative noise in running
speech (Howell and Rosen 1983). All subjects could discriminate
at least two adjacent pairs of 250-Hz wide noise bands at durations
of 80 ms or less. Subjects with better hearing could discriminate
up to six such noise bands. With the subjects who had better hearing,
it was also possible to test with larger bandwidths and over a
wider frequency range.
These results show that for even the most impaired subjects there is a possibility that residual hearing could be used to discriminate between spectrally adjacent bands of noise. This is encouraging for developing a fricative encoding scheme whereby fricatives are represented by simple noise bands, transposed into the subject's residual hearing range.
The experiment reported here examines whether subjects can discriminate the bandwidth of noises when the spectra of the stimuli overlap. Bandwidth is one cue to fricative identity, and would represent a potentially useful additional dimension in a simplified encoding. The better the discrimination abilities of the listener, the more potential there is for flexibility in the encoding strategy, thus allowing the stimuli to be as similar as possible to the original sounds to improve naturalness and facilitate training.
2. Task 1. Bandwidth
Discrimination with fixed centre frequency
This experiment examined the discrimination of noise bandwidth
for noise bands of fixed centre frequency. The aim was to discover
if subjects had retained any useful discrimination abilities which
could be transferred to the identification of encoded fricatives
2.1 Subjects
Five hearing-impaired and four normally hearing subjects took
part. They all had previous experience in psycho-acoustic and
speech perceptual experiments. The hearing-impaired subjects were
aged between 35 and 75 and had post-lingual severe-to-profound
sensori-neural hearing losses. The normally hearing group were
aged between 25 and 45 years old. All subjects underwent hearing
tests to ensure the reported loss was correct. Audiograms for
the hearing impaired subjects are shown in Figure 1.
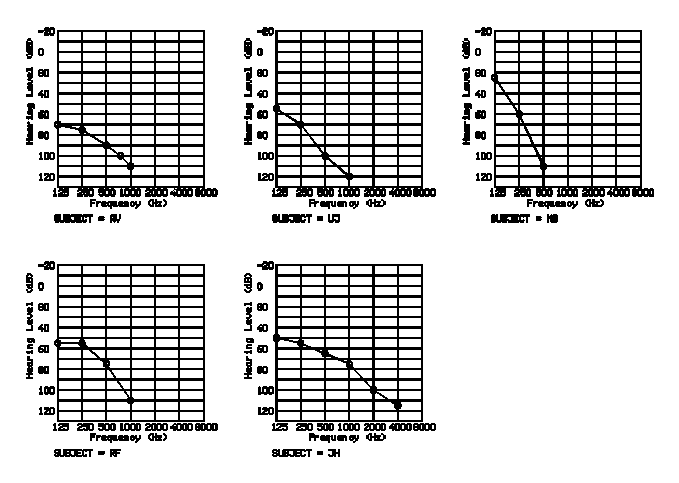
Figure 1. Audiograms for the hearing impaired subjects
2.2 Task and conditions
Subjects were required to discriminate noises of different bandwidths
with a fixed centre frequency. The stimuli were band-pass filtered
noises centred at 300 Hz with a duration of 80 ms. A low centre
frequency was selected to ensure that the stimuli were audible
to all subjects. It was assumed that if subjects could discriminate
the stimuli at short durations they could probably discriminate
them under easier conditions when the durations of the stimuli
were longer. Bandwidths of the noises ranged from 124 to 500 Hz.
500 Hz was chosen for the widest bandwidth because it was wide
enough for there to be a large difference between the narrow and
wide band stimuli but not so wide that the majority of the information
fell outside some of the subjects' hearing range. The narrowest
bandwidth was chosen to be 124 Hz because this was narrow enough
to be useful as a bandwidth for encoding fricatives but not so
narrow as to give difficulties with audibility due to the limited
dynamic ranges of some of the subjects. When the noise bandwidth
is too narrow, subjects have a tendency to choose a lower listening
level to avoid discomfort due to the strong inherent fluctuations.
This can make the stimuli hard to discriminate because much of
the sound falls below absolute threshold, and could also lead
to audible loudness fluctuations being used as a cue to discrimination.
For the purpose of this experiment we tried to eliminate loudness
cues so we could assess how well subjects could discriminate stimuli
on a purely spectral basis. However for the purpose of an encoding
strategy the use of loudness cues would be beneficial to improve
identification.
There were two main conditions; in condition 1 the fixed reference stimulus had the broader bandwidth, this being 500 Hz, and the narrower bandwidth was varied. In condition 2 the reference stimulus had the narrower bandwidth, which was fixed at 124 Hz, and the broader bandwidth was varied.
2.3 Stimulus generation and control
The noise stimuli were derived from a white-noise source, and
band-pass filtered using two Kemo VBF/8 filters (48dB/octave).
Each stimulus was gated on and off with a raised half-cosine envelope
of 5 ms. A Masscomp 5400 was used to control stimulus presentation.
The stimuli were gated by multiplying the noise with a gating
signal derived from a 12-bit D/A converter. After gating and filtering,
the stimuli were sent along a balanced line to a sound attenuating
chamber. A Yamaha P2100 amplifier, Hatfield manual attenuators,
Charybdis programmable attenuators and a potentiometer wheel were
used to control the output levels of the stimuli. The stimuli
were balanced in loudness and jittered in level as described below.
The stimuli were presented monaurally through Beyer Dynamic DT48
headphones; electronic equalisation was used to give a flat headphone
frequency response down to about 70 Hz. An FFT analyser (Ono-Sokki
CF-910) was used to monitor the signal levels and spectra of the
stimuli via a Bruel and Kjær artificial ear.
2.4 Procedure
Psychometric functions were measured in conditions 1 and 2 for
a range of bandwidth ratios using a three-interval two-alternative
forced-choice paradigm. In condition 1 the 500-Hz wide noise was
presented in the first interval and the narrow noise was presented
in either the second or third interval with a 500-Hz wide noise
in the other interval. In condition 2 the 124 Hz noise band was
played in the first interval and the wider noise was presented
in either the second or third interval with a 124-Hz wide noise
in the other interval. The subjects had to decide whether the
second or third stimulus was the odd one out and press the appropriate
button on a response box. Feedback lights were used after each
trial to indicate the correct response. Within a run the bandwidths
of the two noises were fixed and a percent correct score was obtained
from a hundred trials. Each point on the psychometric function
was repeated in a different session and the scores from the two
sessions were combined producing a percent correct score from
200 presentations. All subjects received a minimum of 4 hours
training before data collection began. At the start of each session
the threshold for detecting the noise bands was confirmed to ensure
that the subject's thresholds had not changed.
2.4.1 Loudness balancing
Three precautions were taken to ensure that discrimination was
not based on loudness differences. For the hearing-impaired subjects,
all stimuli were presented through a filter based on equal-loudness
judgements. For all subjects, the two stimuli used in a given
run were additionally matched in loudness. Finally, a random amplitude
jitter was applied to stimuli within each trial.
a) Equal-loudness frequency shaping
Prior to testing, an individually tailored equal-loudness FIR (finite impulse response) filter was set up for each hearing-impaired subject. The filter parameters were individually calculated from a loudness balancing experiment. The procedure involved subjects balancing the level of 200-ms tones with 5-ms raised half-cosine ramps at 125-Hz intervals from 125 - 1125 Hz (where possible). Balancing began by comparing the loudness level of a 500-Hz tone at comfortable listening level with the loudness level of a 625-Hz tone, the two tones were played in continuous alternation and the level of the 625-Hz tone was adjusted until it appeared equally loud to the 500-Hz tone. This procedure was repeated for all the audible tones within the 125 - 1125 Hz range above and below 500 Hz. 500 Hz was always kept as the reference tone. Each match was made three times and the average intensity level of the matches was used. The attenuation values required to produce the average intensity level were recorded at all frequencies. A matching filter shape was interpolated from these values and the FIR filter coefficients were generated to implemented this response on an EF8 programmable filter.
b) Pair-wise loudness matching of stimuli
At the start of each run subjects were required to rotate a potentiometer wheel whilst hearing the two noises in alternation. The potentiometer controlled the level of one noise while the level of the other noise was fixed. The subjects were instructed to adjust the wheel and find the point at which the two sounds appeared to be equally loud. They were advised to pass through the equal loudness point a few times to ensure accurate balancing. This procedure was carried out three times and the mean level was used as the point of equal loudness. Once the equal loudness point was determined the subject listened to the stimuli again to ensure they were comfortably loud. If necessary the output level was adjusted.
c) Level Jitter
In order to eliminate any residual loudness differences due to balancing errors, levels were randomly varied over a 3 dB range from stimulus to stimulus for the hearing-impaired group and over a 6 dB range for the normally hearing subjects. The level of jitter was determined from a pilot study to assess the amount of jitter which was comfortable for the subject so to eliminate loudness cues but preserve performance. The normally hearing subjects were able to tolerate a higher level of jitter than the hearing-impaired subjects.
2.5 Results of task 1
Psychometric functions (percent correct as a function of the logarithm
of the bandwidth ratio) were fitted by Probit analysis (Finney,
1971) and the 75% point estimated. The 75% level was chosen because
this point represented a bandwidth ratio where performance was
above chance (50 % for a two alternative task) but well below
the ceiling level.
The 75% threshold point was used as a way of comparing performance across subjects and between the normally hearing and hearing-impaired groups.
Psychometric functions from conditions 1 and 2 for the normally
hearing subjects are plotted in figures 2 and 3 and those for
the hearing-impaired subjects are shown in figures 4 and 5. Figures
2 and 4 are the functions when the wide noise band (500 Hz) was
fixed and figures 3 and 5 show the functions when the narrow band
(124 Hz) was fixed.
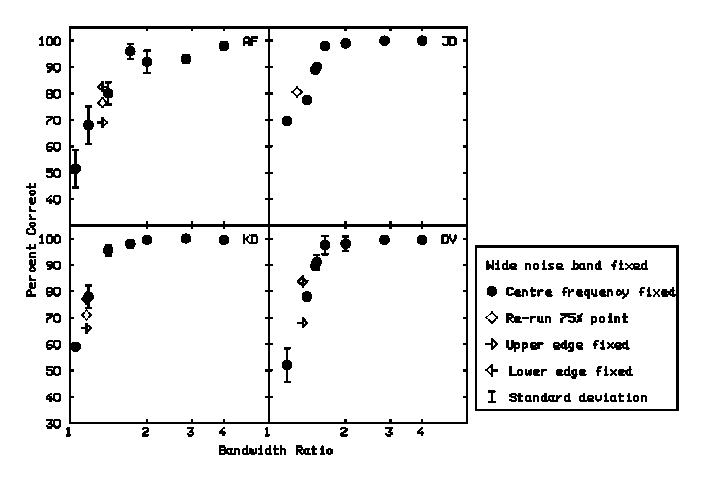
Figure 2. Psychometric functions for the normal hearing group in condition 1. The bandwidth ratio is plotted along the abscissa and the percent correct is shown on the ordinate. The mean percent correct scores from the two sessions as a function of bandwidth ratio are shown by the filled circles and the vertical lines represent plus and minus one standard deviation for each point.
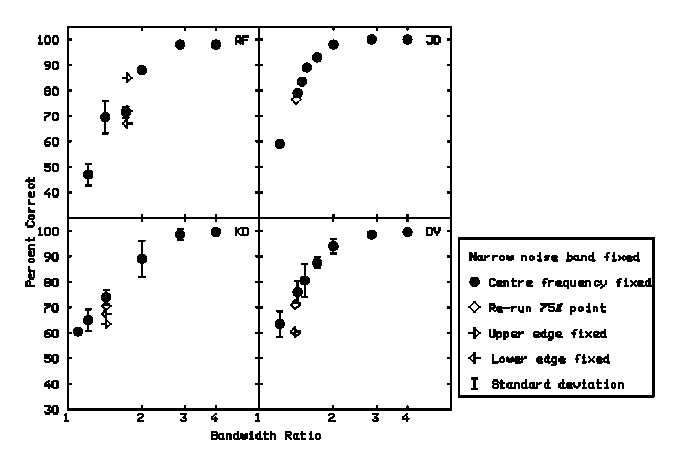
Figure 3. Psychometric functions for the normal hearing group in condition 2
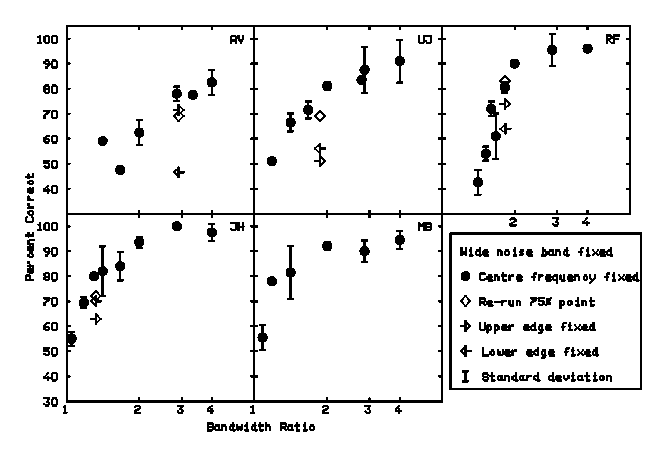
Figure 4. Psychometric functions for the hearing-impaired group in condition 1
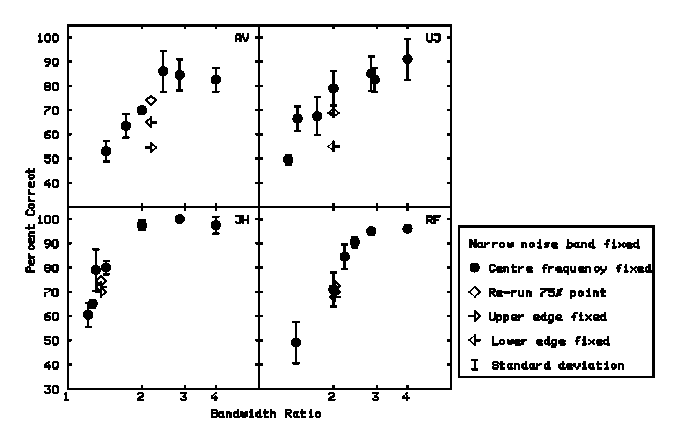
Figure 5. Psychometric functions for the hearing-impaired group in condition 2
For the normally hearing group the mean 75% correct threshold bandwidth ratios were 1.30 and 1.50 for conditions 1 and 2 respectively. The threshold ratio of 1.30 for condition 1 corresponds to being able to discriminate bandwidths of 500 Hz and 385 Hz, which is an absolute edge difference of 57.5 Hz on each edge. In percentage terms this is 12% on the upper edge and 54% on the low frequency edge. A ratio of 1.50 in condition 2 corresponds to the bandwidths of 124 Hz and 186 Hz being discriminable. This corresponds to an edge difference of 31 Hz on each edge, and equivalent percentage differences of 9% on the high frequency edge and 13% on the low frequency edge.
For the hearing-impaired group the mean threshold bandwidth ratios for subjects UJ, RF and JH were 1.67 and 1.80 for condition 1 and 2 respectively. Subjects MB and AV had much larger bandwidth ratios at threshold in condition 1 than subjects UJ, RF and JH. This could have been because they had difficulty using the high frequency edge of the stimuli because it fell in a region of poorer hearing so they had to rely on the low frequency edge alone. If the results from all the hearing-impaired subjects were used to compute a mean threshold bandwidth ratio, then the result for condition 1 was 2.16 and that for condition 2 was 1.89. A threshold ratio of 1.67 corresponds to being able to discriminate noise with a bandwidth of 500 Hz from noise with a bandwidth of 299 Hz. This corresponds to an edge difference on both the upper and lower edges of 100.5Hz, which when translated in to a percentage difference (of the cut-off frequency of the fixed noise), is 22% on the upper edge and 67% on the lower edge. The 1.80 threshold ratio for condition 2 corresponds to discriminating bandwidths of 124 Hz and 223 Hz, a difference of 49.5 Hz on each edge, a percentage difference of 14% on the high frequency edge and 54% on the low frequency edge.
3. Task 2. Discrimination
of spectra with single edge frequency cues
A second task was run to assess if the subjects were favouring
any particular edge of the noise bands for discriminating the
stimuli. For the hearing-impaired subjects in particular, where
hearing ability is generally better at lower frequencies, it was
thought possible that only the lower band edge frequencies were
being used as a discrimination cue. Hence, stimuli were generated
with either the upper or lower edge frequencies of the stimulus
pair set to the same frequency, and the other edge frequencies
differing.
3.1 Procedure
The bandwidth ratios corresponding to the 75 % point estimated in conditions 1 and 2 of task 1 were used as the point for assessing if subjects were favouring a particular edge of the stimuli for discrimination. The first stage of testing was to check the accuracy of the 75% point for both conditions 1 and 2 by checking the discrimination of the pair of noises corresponding to the 75% point.
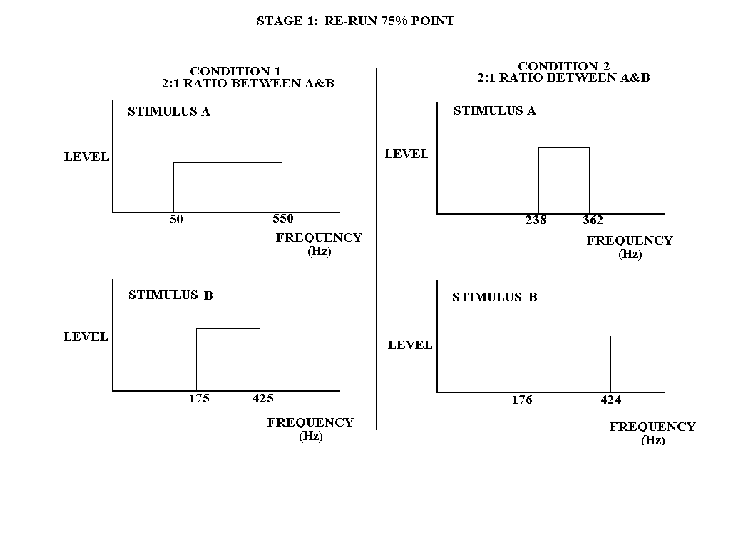
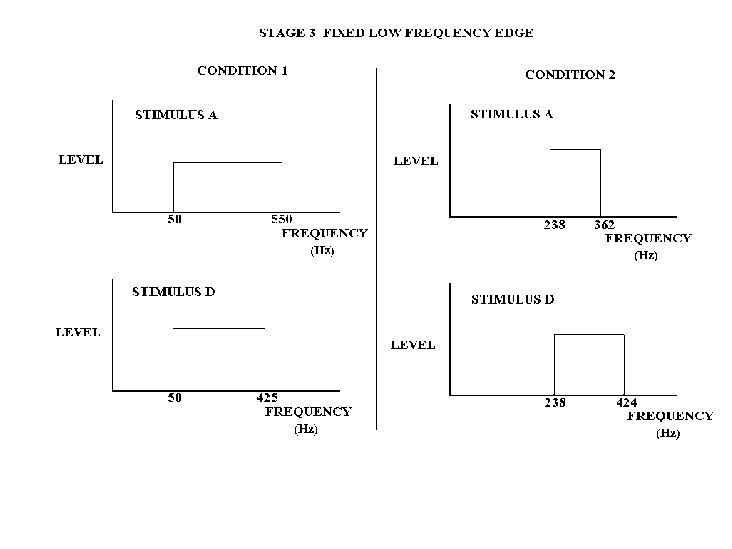
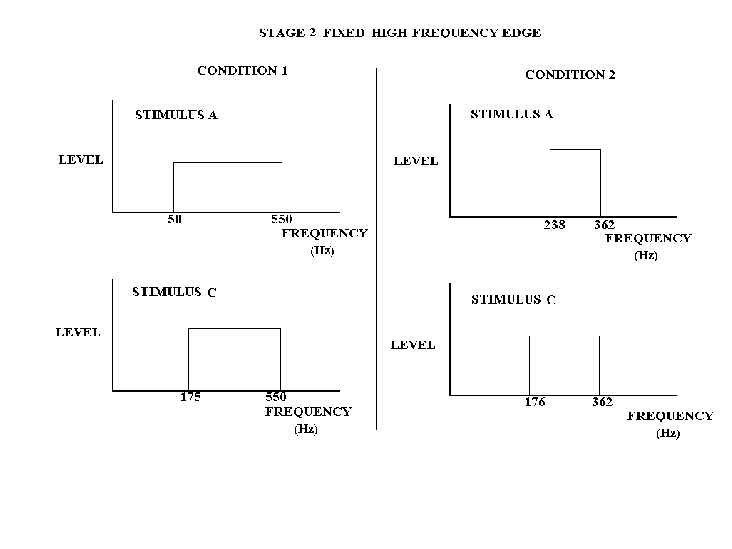
For each of condition 1 and 2, there were two further conditions in which either the upper or lower edge frequencies of the variable stimulus were fixed at the same frequency as those of the reference noise band, i.e. for condition 1 it was 50 Hz for the lower edge and 550 Hz for the upper edge and in condition 2 it was 238 Hz for the lower edge and 362 Hz for the upper edge.
The other edge of the variable stimulus was the same frequency as the corresponding edge in the 75% estimate. A stylised representation of an example set of stimuli is shown in figure 6. The example is based on a 2:1 bandwidth ratio at the 75% point.
Each point was produced from a presentation of 200 three-interval trials, 100 run in one session and a 100 run on a separate day. In all other respects the procedure was the same as that for task 1, as were the subjects.
3.2 Results of task 2.
| Hearing-Impaired group | ||||||||
| 75 % point | Ratio From Probit | % score Re-test | Upper edge fixed | Lower edge fixed | Ratio From Probit | % score Re-test | Upper edge fixed | Lower edge fixed |
| Subj | Condition 1 (w-b fixed) | Condition 2 (n-b fixed) | ||||||
| UJ | 1.87 | 69.0 | 51.0 | 56.0 | 2.00 | 69.0 | 69.0 | 55.0 |
| JH | 1.32 | 72.0 | 63.0 | 70.0 | 1.36 | 74.5 | 70.0 | 72.0 |
| RF | 1.82 | 83.0 | 74.0 | 64.0 | 2.03 | 70.0 | 72.5 | 68.0 |
| AV | 2.91 | 69.0 | 71.5 | 46.5 | 2.18 | 74.0 | 54.5 | 65.0 |
| MB | 2.87 | 67.0 | ||||||
| Normally hearing group | ||||||||
| 75 % point | Ratio From Probit | % score Re-test | Upper edge fixed | Lower edge fixed | Ratio From Probit | % score Re-test | Upper edge fixed | Lower edge fixed |
| Subj | Condition 1 (w-b fixed) | Condition 2 (n-b fixed) | ||||||
| DV | 1.36 | 83.5 | 68.0 | 84.0 | 1.40 | 71.0 | 60.0 | 60.5 |
| JD | 1.29 | 80.5 | 1.41 | 76.5 | ||||
| KD | 1.16 | 71.0 | 66.0 | 77.0 | 1.43 | 70.5 | 63.5 | 67.5 |
| AF | 1.34 | 76.5 | 69.0 | 82.5 | 1.74 | 72.0 | 85.0 | 67.0 |
Table 1 shows the estimated 75 % correct bandwidth ratio thresholds interpolated from the Probit analysis. The empty diamonds in figures 3,4,5 and 6 show scores obtained when the predicted 75 % points were re-run. The upward-pointing arrows show the scores when the upper edges of the noises were fixed and the downwards- pointing arrows show the scores when the lower edges were fixed.
Figure 7 shows the estimated 75 % points for all the subjects. The initials under each point refer to a subject. The open squares indicate the 75% point estimated from condition 1 and the open diamonds from condition 2.
The repeated 75% points ranged from 67-83.5%, this good repeatability indicates that the estimates from the Probit analysis were reasonably accurate.
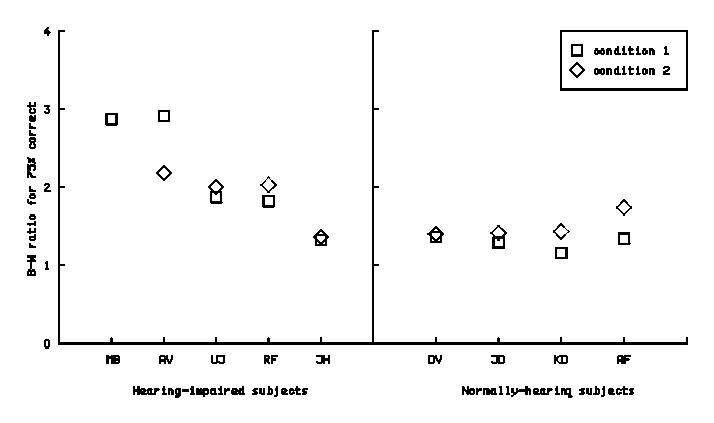
Figure 7. Estimated 75% points for all subjects in conditions 1 and 2
One of the hearing-impaired subjects (MB) only managed to complete the psychometric function in condition 1 because of work pressures.
The results from task 2 using the wider bandwidth reference stimulus, showed that all the normal-hearing subjects and the hearing-impaired subject JH performed similarly when only the high frequency edges of the stimuli were available for discrimination as when both edges were available. This indicates that they attended to the high frequency edge to discriminate the stimuli when both edges were available. For the hearing-impaired subjects whose high frequency hearing was not as good as JH the results are slightly different. Subjects RF and UJ appeared to use both edges for discrimination because neither of the asymmetric conditions on their own gave a similar level of performance to that when both edges were available and subject AV who had the poorest hearing relied totally on the low frequency edge of the stimuli.
The results from task 2 using the narrower bandwidth reference
stimulus show that the normal-hearing subjects DV and KD and the
hearing-impaired subject AV appeared to use both edges for discrimination
in the symmetric condition. This is indicated by the fact that
neither edge alone produced performance as good as when both edges
were available. Probably the subjects were integrating cues from
both band edge regions. Subject UJ appeared to use the low frequency
edge and the normal-hearing subject AF and the hearing-impaired
subjects JH and RF appeared to be able to do the task with either
edge. It is hard to know what cues AF, JH and RF were using in
the symmetric condition to discriminate the stimuli because they
seem to be capable of performing the task with the same degree
of success with either edge available to them but did not perform
better when both edges were available.
4. Discussion
Speech is a complex and dynamic signal, continuously varying in
frequency, amplitude and time. The production of one phoneme
can vary dramatically with such factors as the preceding and following
speech sounds and the rapidity of speech. Although this work
appears to treat speech as a very static entity focusing on specific
speech cues, the final aim is to provide an encoded signal that
varies in a similar way to the original speech but with some of
the features simplified to improve perception for those people
who can not cope with the complexity of the original speech. Such
an encoding strategy would include not only bandwidth but also
other cues, for example intensity and centre frequency. Bandwidth
is expected to play an important role in improving naturalness
and providing a further cues to improve perception.
The results of the experiments carried out in this paper have been very encouraging. It was interesting to discover that all the subjects tested could, to some degree, perform the tasks. This suggests that even profoundly hearing-impaired subjects have hearing abilities in the low-frequency region which potentially could be used to identify encoded speech stimuli. These abilities are also very relevant to the use of other prosthetic strategies such as frequency transposition (Velmans, 1973; Braida et. al., 1976; Rosenhouse, 1989).
In general the hearing-impaired group performed more poorly than the normally hearing group except for JH whose results fall within the normally hearing range. For both groups, thresholds were usually slightly larger when the narrower bandwidth was fixed; the impaired listener AV was the only exception. This may be because, when the narrow bandwidth was fixed, the non-overlapping frequency region of the stimuli was smaller for a given bandwidth ratio. For example for an equivalent ratio of 2:1, this would correspond to a noise of 500 Hz bandwidth being discriminated from a noise of 250 Hz bandwidth in condition 1, or a noise of 124 Hz bandwidth being discriminated from a noise of 248 Hz bandwidth in condition 2.
Another interesting finding from this experiment is how similar the performance of the normal-hearing and hearing-impaired subjects was given the degree of hearing loss of some of the subjects. Threshold bandwidth ratios were 1.30 and 1.67 in condition 1 for the normal-hearing and hearing-impaired subjects respectively, and 1.50 and 1.80 in condition 2. It appears that bandwidth could be a very important cue for encoding fricatives because of its accessibility to hearing-impaired subjects.
Is discrimination based on the upper, lower or both edges?
Task 2, where we assessed performance when either the upper or
lower frequency edge was fixed, should give us an insight in to
whether performance was based upon attending to one edge, both
edges or either edge. It may be that there was quite a strong
edge pitch cue available to the subjects. The noise bands used
in this experiment are similar to those used by Fastl (1971).
He found that both edges of a 600 Hz wide noise band in the low
frequency region elicited a strong pitch sensation for normally
hearing listeners. At higher centre frequencies the pitch sensation
related more to the centre frequency of the band of noise and
not the edges. Our stimuli were low in frequency so it is likely
that edge pitch cues were available. We also used stimuli with
fairly sharp cut-off slopes (48 dB/Oct.) which increase the pitch
strength of the edge pitch cues (Fastl, 1980).
Outcome of task 2 using the wider bandwidth stimuli.
Where the fixed reference stimulus had the wider 500 Hz bandwidth, the results from task 2 appear to be fairly straightforward. If the subject had useable hearing around 500 Hz, then the high frequency edge was used for discrimination, probably because the low frequency edges would have fallen in a frequency region (50 - 100 Hz) where discrimination abilities are poorer (Usher, 1976; Harris, 1952) than at higher frequencies. The hearing-impaired subjects who did not have such good hearing at 500 Hz, could not make such effective use of the high frequency edges of the stimuli for discrimination. Subjects UJ and RF used both edges of the stimuli and probably integrated cues from both band edge regions, whereas subject AV relied totally on the low frequency edge which may explain why her ratio for the symmetric condition was typically much worse than for the other subjects.
Outcome of task 2 using the narrower bandwidth stimuli.
Where the fixed reference stimulus had the narrower 240 Hz bandwidth, the results from task 2 were not so easy to interpret. This is probably because there were more perceptual cues available to the subjects. The low frequency edge fell in a higher, more useable, frequency region, approximately around 180-240 Hz. Furthermore, the subjects who weren't able to use the high frequency edge previously probably could in condition 2 because it was much lower, approximately around 360-420 Hz. Some of the subjects relied on both of the edges whereas other subjects focused their attention on one edge but could have performed just as well with the other edge. Subject UJ was the only subject relying only on the low frequency edge.
Related work
The results from this study are consistent with those of Pickett, Daly and Brand (1965). They measured just-noticeable differences (jnds) for the cut-off frequency of low pass noise at a variety of cut-off frequencies (250, 500, 1000, 1500 and 2000 Hz) in normal and severely cochlear damaged subjects. At 250 Hz they found that the jnd in normally hearing subjects was 12%, which represents a 30 Hz difference. At the higher frequencies their jnds ranged from 3 to 5%. Another interesting result from the Pickett, Daly and Brand study was that the difference between the two groups of subjects was not large. The jnd for the hearing-impaired subjects was 15% at 250 Hz, which corresponds to an absolute frequency difference of 37.5 Hz, and performance worsened at higher cut-off frequencies.
The normal-hearing subjects and subjects JH appeared to be attending to the high frequency edge to perform the task in condition 1. If we assume that these subjects were not attending to the low frequency edge it allows us to compare our results to those of Pickett, Daly and Brand (1956). The mean 75% bandwidth ratio in condition 1 for the normal-hearing subjects and JH was 1.30, corresponding to a frequency difference of 57.5 Hz on each edge. If the jnd for high frequency edge is calculated as a proportion of the high frequency edge of the narrower noise, then the percentage difference was 11.7%. This is similar to the 12% value calculated by Pickett, Daly and Brand. The cut-off frequency in our experiment was slightly higher (492.5 Hz) so it would perhaps be predicted from their results that the jnd in our experiment would be slightly less. Nevertheless our results are certainly in a similar range to those of Pickett, Daly and Brand indicating that normal-hearing subjects can only detect quite large spectral differences in noise stimuli.
It is also interesting to note that the normal-hearing and hearing-impaired subjects in the Pickett, Daly and Brand study performed very similarly to each other, which is also what we found.
Summary
These results show that profoundly hearing-impaired subjects were able to detect changes in the bandwidth of noise stimuli under conditions where the loudness of the bands did not provide useable discrimination cues. This ability could potentially be exploited in the encoding of phonetically relevant acoustic cues in aperiodic speech sounds. It remains to be determined whether bandwidth could be used as a cue for absolute identification as opposed to discrimination.
Further work
Further psychophysical investigations into the hearing of the subjects used here is required to determine the mechanisms they used to perform the task and to discover why the difference between the two groups is so small.
Identification experiments will be conducted to determine the usefulness of bandwidth as a cue for speech perception in a speech coding where acoustic cues in high frequency aperiodic speech are represented as low frequency noise bands.
Acknowledgements
The authors would like to thank John Deeks, Brian Moore, Marina
Rose and Stuart Rosen for helpful comments on earlier drafts of
this paper. This work was supported by the Medical Research Council
and TIDE project TP1217 OSCAR
References
Braida, L. D., Durlach, N.I., Hicks B.L., Reed, C.M. and Lippman,
R.P. (1976) Matching speech to the residual auditory function
III - Review of previous research on frequency lowering. Research
Laboratory of Electronics, Massachusetts Institute of Technology,
Cambridge, Massachusetts.
Fastl, H. (1971) Über tonhöhempfindungen bei rauschen (Pitch of noise). Acustica. 25, 350-354.
Fastl, H. (1980) Pitch strength and masking patterns of low-pass noise. In Psychophysical, physiogical and behavioural studies in hearing. Ed. G. van den Brink and F.A. Bilson. 334-340.
Faulkner, A., and Rosen, S. (1990). "Spectral and temporal resolution in the profoundly deaf," Br. J. Audiol., 24, 193-194.
Faulkner, A., Rosen, S., and Moore, B. C. J. (1990) "Residual frequency selectivity in the profoundly hearing-impaired listener," Br. J. Audiol. 24, 381-392. Also in Speech, Hearing and Language, work in progress, University College London, Department of Phonetics and Linguistics, 4, 82-97.
Faulkner, A., Ball, V., Rosen, S. R., Moore, B. C. J., and Fourcin A. J. (1992) "Speech pattern hearing aids for the profoundly hearing-impaired: Speech perception and auditory abilities". Journal of the Acoustical Society of America, 91, 2136-2155.
Finney, D.J. Probit Analysis. (1971) Cambridge: Cambridge University Press.
Fourcin, A. J. (1977) "English speech patterns with special reference to artificial auditory stimulation" In: A review of artificial auditory stimulation: Medical Research Council Working Group Report, edited by A. R. D. Thornton. (Institute of Sound and Vibration Research, University of Southampton, pp 42-44.
Harris J.D. (1952) Pitch discrimination. Journal of the Acoustical Society of America, 24, 750-755.
Harris, K.S. (1958) Cues for the discrimination of American English fricatives in spoken syllables. Lang. Speech. 1, 1-7.
Heinz, J.M. and Stevens K.N. (1961) On the properties of voiceless fricative consonants. Journal of the Acoustical Society of America, 22, 6-13.
Howell, P. & Rosen. S. (1983) Closure and frication measurements and perceptual integration of temporal cues for the voiceless affricate / fricative contrast. Speech, Hearing and Language: Work in Progress, Department of Phonetics and Linguistics, University College London, 1: pp 109-117.
Howell P., and Rosen S., (1986) Closure and frication measurements and perceptual integration of temporal cues for the voiceless affricate fricative contrast. Speech Hearing and Language: Work in Progress. Dept. of Phonetics and Linguistics, University College London. 1, 108-117.
Pickett, J. M., Daly, R.L. and Brand S.L. (1965) Discrimination of spectral cutoff frequency in residual hearing and in normal hearing. Journal of the Acoustical Society of America, 38, 923 (A).
Rosen, S., Faulkner, A. and Smith, D. A. J. (1990) The psychoacoustics of profound hearing impairment. Acta Oto-laryngologica (Stockh), Suppl. 469, 16-.22
Rosen, S., and Fourcin, A. (1983) When less is more - Further work. Speech Hearing and Language: Work in Progress. Dept. of Phonetics and Linguistics, University College London. 1, 1-27.
Rosen, S., Walliker, J.R., Fourcin, A.J. & Ball, V. (1987) A micro-processor based acoustic hearing aid for the profoundly impaired listener. Journal of Rehabilitation Research and Development, 24: pp 239-260.
Rosenhouse, J. (1989) The Frequency Transposing Hearing Aid: A new prototype. The Hearing Journal. Feb. 14-15.
Usher, N. (1976) Pitch discrimination at low frequencies. M.Sc. Thesis. Chelsea College, University of London.
Velmans, M. (1973) Aids for deaf persons. U.K. Patent 1340105.
Vickers, D. A. and Faulkner, A. (1993) "Results from noise discrimination tasks with the hearing impaired" Speech, Hearing and Language, Work in Progress, Department of Phonetics and Linguistics, University College London, 7, 257-265.
Vickers, D.A. and Faulkner A. (1996) Noise spectrum discrimination by severe-to-proundly hearing-impaired listeners. In Psychoacoustics, Speech and Hearing Aids. Ed. B. Kollmeier. World Scientific.
Wei, J. (1993) A speech pattern processing method for Chinese listeners with profound hearing loss. Ph. D. Thesis, Department of Phonetics and Linguistics, University College London.
© Deborah A. Vickers and Andrew Faulkner
 for comments