

Abstract
The SiVo-3 hearing aid provides voicing, fundamental frequency,
voiceless excitation, and amplitude envelope information as a
supplement to lip-reading for profoundly hearing impaired people.
The extraction of voicing and voice fundamental frequency is performed
by a real-time multi-layer perceptron that is trained to locate
in noisy speech acoustic events associate with the instant of
laryngeal closure. Training makes use of reference data from a
laryngographic electrode recording. The performance of a 'C' language
off-line prototype algorithm and a real-time version for the TI
TMS320C50 processor has been compared to standard Cepstral and
SIFT algorithms. In comparisons with quiet and noisy speech, the
off-line 'C' language MLP showed superior detection of voicing
in speech to the reference methods. The accuracy of the off-line
MLP in fundamental frequency estimation was similar to that of
SIFT. For speech in quiet, the Cepstral method was substantially
more accurate than the other methods in fundamental frequency
estimation. The Cepstral method's fundamental frequency estimation
accuracy was more affected than the MLP and SIFT algorithms by
the presence of noise so that at a +10 dB signal-to-noise ratio,
the Cepstral method performed similarly to the others.
The real-time MLP was compared to the same two reference methods for speech in quiet, with similar results to that from the off-line algorithm. It is concluded that the MLP method provides acceptable performance given the requirements of this hearing aid application, where voicing detection is of primary importance and errors of fundamental frequency estimation are relatively innocuous given the limited frequency discrimination shown by profoundly impaired listeners.
1. Introduction
The SiVo-3 hearing aid, a major component of the TIDE project
OSCAR, features a speech-analytic mode designed to provide lipreading
support for profoundly hearing impaired listeners. This speech-analytic
mode provides simple acoustic signals that signal acoustic speech
elements that are known to be valuable supplements to lipreading
for this population (e.g. Faulkner et al., 1993). The selected
elements are:
Periodic speech is represented by a sinusoid within the comfortable hearing range that follows the extracted fundamental frequency. Aperiodic speech is represented by a noise with a spectrum shaped to match the comfortable listening level between 125 and 2000 Hz. Speech amplitude envelope, after 2:1 logarithmic compression, is used to amplitude modulate both sinusoid and noise signals, with maximum and minimum levels limited by threshold and maximal comfortable levels.
The present report describes evaluations of both an off-line 'C' prototype and a real-time version of the algorithm employed by the SiVo-3 aid for the extraction of the voicing pattern and voice fundamental frequency. The real-time SiVo-3 algorithm is also compared with a previous algorithm of somewhat different structure that was used in the preceding SiVo-2 aid. One reason for the choice of a multi-layer perceptron (MLP) for the SiVo-3 is that the computations used by an MLP can be performed very efficiently by a fixed-point digital signal-processor chip. A second reason comes from the initial demonstration by Howard and Huckvale (1989) that an MLP can be rather effective for the extraction of voice fundamental frequency from noisy speech. The use of an MLP was expected to be a significant advance, particularly in respect of noise resistance, over previous real-time peak-picking methods (Howard, 1989) that had been used both in the original SiVo aid and also in the Nucleus cochlear implant speech processor.
1.1 Performance targets
In the audio-visual perception of consonants, the gross timing
of the voicing pattern has been shown to be the principal source
of auditory information (Faulkner, Rosen and Reeve). It is, therefore
expected the accuracy of the voicing pattern cues from the SiVo-3
will be of major importance. An accurate representation of fundamental
frequency (Fx) is highly desirable, since supra-segmental
intonation information also contributes significantly to audio-visual
perception of connected speech. Another important aspect of performance
in this applications is that the extracted fundamental frequency
information can represent the irregularity of vocal fold vibration
in order to give the user feedback on their own voice control
(Ball et al., 1990). For this purpose, a time-based analysis of
fundamental frequency that operates cycle-by-cycle is highly desirable.
2. Algorithm structure
The approach presented here employs a multi-layer perceptron (MLP)
neural network pattern classifier (Rumelhart & McClelland,
1988) which carries out a non-linear mapping of the input data
set to the output unit of the network. The MLP classifiers discussed
here depend on the use of supervised training by which the neural
net is provided with labelled reference data that specifies the
correct classification of the network output for each time-frame
of the training data., whereby one frame per period (at the moment
of larynx closure) is designated as voiced and all other frames
as unvoiced. This allows the algorithm to give cycle-by-cycle
estimates of Fx.
The algorithm consists of three parts: 1) the pre-processor, 2) the main extractor, and 3) a post-processor. The evaluations here cover two related MLP networks that differ in both the pre-processing and the network structure.
The input data to the MLP classifier is a number of waveform samples from the pre-processor. The analysis window needs to be long enough to allow the classifier to "see" one or more periods of speech. The two MLPs used here have analysis windows of 30.5 ms (MLPa) and 20.5ms (MLPb).
The MLP is trained with the objective of making its final output unit produce a high output at the time of vocal fold closure in the speech input, and a low output at other times. The algorithm is, therefore, estimating the time at which each vocal fold closure occurs, from which each successive fundamental period is then estimated.
2.1 MLPa Pre-processor
MLPa is the designation of the MLP used in the SiVo-3 MLP. The
pre-processing stage principally performs data reduction of the
speech signal. The speech input is low-pass filtered at 900 Hz,
using a 4th order IIR low-pass filter. The signal is then down-sampled
to a 2 kHz sample rate to match the cycle rate of the MLP. Each
cycle of the MLP has as its input data the speech waveform samples
from 61 successive 0.5 ms frames.
2.2 MLPb Pre-processor
The second MLP considered here, MLPb, is a predecessor to MLPa.
It is similar to the algorithm described by Walliker and Howard
(1990) and to that used in the earlier SiVo-2 device as evaluated
in the TIDE project TP133/206 STRIDE. The input data for the MLPb
algorithm is sampled both in time and frequency from the speech
signal. The speech is first processed through 6 band-pass filters,
and then the output of each filter is down-sampled to a 2 kHz
sample rate. Forty-one successive frames from each of the six
filters provide the input data to the MLP. MLPb differs from the
MLP used in the SiVo-2 aid in the use of a post-processing buffer.
2.3 MLP structures
The main fundamental frequency extractor is a MLP pattern classifier
containing an input layer, two hidden layers, and an output layer.
Theoretically, a one-hidden-layer MLP network is capable of forming
an arbitrarily close approximation to any non-linear decision
boundary for any classification task (Makhoul et al., 1989). In
practice a small two-hidden-layer network can be used where a
one-hidden-layer network would require an unrealistically large
number of nodes (Chester, 1990). The input layer's size is determined
by the number of inputs. MLPa has 61 input units compared to the
246 input units of MLPb, and hence it is possible, with a similar
level of computational effort, to use more units in the intermediate
layers of MLPa. The MLPa algorithm has a 61-20-6-1 structure,
while MLPb has a structure of 246-6-6-1 units. Both structures
are fully connected.
2.4 Training reference data
The reference target data is derived from the laryngograph (Lx)
signal (Fourcin & Abberton, 1971) which directly represents
the events in the closed phase of vocal fold vibration. Other
work has been reported using the raw Lx signal as the reference
data to train an MLP classifier for larynx excitation (Denzler
et al., 1993). Some disadvantages of using the unprocessed Lx
signal are that 1) the DC offset of the Lx signal can be significant,
and 2) the amplitude range of the Lx signal varies widely from
speaker to speaker. In this study, the Lx signal was processed
to make it more suitable for MLP training.
2.4.1 Lx processing for MLPb
The Lx-based training data for the earlier MLPb algorithm was
a discontinuous unit-pulse train, with the value of one at each
estimated time of vocal fold closure, and value zero elsewhere.
The discontinuous nature of this training reference is likely
to be a disadvantage, since there is no information in the reference
signal to indicate frames that are close to, but not exactly synchronous
with, a vocal fold closure. Hence, an MLP output pulse in the
frame adjacent to the target frame cannot be treated differently
from an output pulse many frames away from the target frame in
respect of its contribution to the error during training. The
reference data was generated by automatic labelling of the Lx
signal to identify instants of larynx closure. As no perfect automatic
labelling method was available, subsequent hand-correction was
required.
2.4.2 Lx processing for MLPa
For MLPa, the reference signal was a continuous one. The Lx signal
was filtered using a zero-phase 8th-order 20 Hz IIR high-pass
filter to remove DC. It was then half-wave rectified and normalised
cycle-by-cycle to the range between 0.0 - 1.0. By applying this
processed Lx signal as the reference for the MLP classifier, we
avoided hand-labelling which is time-consuming and can be inaccurate
(Barnard, 1991). The continuously varying reference signal contains
information that may be relevant to the training process at every
sample value of each vocal fold cycle.
2.4.3 Recording of training data
The training data were recorded in a non-acoustically treated
room at the Department of Phonetics and Linguistics, University
College London, with a 50 cm speaker to microphone spacing. The
data consisted of two signals, the speech pressure waveform and
the laryngograph signal. Eight speakers (four male and four female)
each read two passages "Arthur the Rat" and "The
Rainbow Passage". A speech spectrum shaped noise was added
to part of the speech waveform training data, at speech-to-noise
ratios (S/N) of 20, 15 and 10 dB. S/N ratio was determined from
the maximum speech rms level measured in a 500 ms window
and the noise rms level. In order to provide training data
that represented a range of speech input levels, parts of the
noisy and quiet training data were attenuated by 0, 6 or 12 dB.
2.5 Training method
The network training used a standard back propagation method (Rumelhart
et al., 1986). We know from the Generalised Delta Rule that the
current weight change in the MLP network DWij(n)
is proportional to the gradient descent in the error E of the
input/output pattern,
DWij(n)
µ - h  ,
,
where h is a positive constant known
as the "learning rate". It is known that training can
be speeded up by increasing h. However,
oscillations eventually arise. The gradient descent method can
be enhanced by introducing a "momentum term" from the
previous weight change as:
DWij(n)
µ - h  +
+ DWij(n-1)
,
where the damping value  acts to optimise
the learning behaviour. It not only offsets oscillations but also
increases the effective learning rate. However, if
  is too large, it will dominate the weight update and the updating
direction can deviate far from the steepest gradient. Here an
adaptive method for choosing h and
 was employed, in which the weights of
the MLP are adapted by changing the learning parameter as a function
of the direction of adaptation in the parameter space (Chan &
Fallside, 1987). This method attempts to eradicate two specific
weakness of the fixed coefficient learning algorithm: oscillations
across the walls of the ravine of the error surface and the long
search caused by the shallow gradient of the error surface in
the weight space.
The standard gradient descent adaptation method modifies the MLP weights after all the training data samples have been presented to the network (batch learning). However, our experience has been that it is faster to update the weights after the presentation of a subset of training data (on-line learning).
The process of computing the gradient and adjusting the weights is repeated until a minimum is found. In practice, it is difficult to automate location of the error minimum. Here, the method of cross-validation was used to monitor generalisation performance during learning. The method of cross-validation works by splitting the data into two sets: a training set that is used to train the network, and a test set that is used to measure the generalisation performance of the classifier. During training, the performance of the classifier on the training data will improve, but its performance on the test data will only improve to a point, beyond which its performance on other data will start to deteriorate. This is the point where the network starts to over-learn, and it is here that the learning process should be terminated.
A number of training runs were made with different random initial coefficients for the MLP as a precaution against finding local minima in the error space. The run giving the lowest overall error from the training data was selected to determine the MLP coefficients that were ultimately used.
2.6 Post-Processor
The post-processing stage performs error correction and smoothing
of the raw estimates from the main extractor. The post-processor
outputs a fundamental period marker for each estimated fundamental
period. The history of several previous output periods needs to
be stored in order to correct the errors and smooth the output
from the main extractor. A 20.5 ms buffer was introduced which
could hold 40 samples of previous MLP output and the present output.
This is shown in Figure 1.

Figure 1:Buffer Post-Processor.
Each incoming MLP output is stored at the beginning of the buffer and all the other values in the buffer are shifted along by one frame. When the value at the end of buffer is both a local peak and exceeds a pre-determined primary threshold, the processor will look along the buffer for a second peak. If there is a second peak within the buffer, the time difference between the first and second peaks is calculated. If this fundamental period Tx is the first period after a silent or a voiceless speech segment, it is immediately accepted as a valid output. If it occurs within 30 ms of a previously detected period of voiced excitation, this Tx value is compared with the estimated previous fundamental period Te, where Te is the average of the previous two fundamental periods: (Tx-1+Tx-2)/2). If Tx is within 20% of Te, then Tx is accepted as a valid output. If Tx is not within 20% of Te, then the processor will look for a second peak that is within 20% of Te. If a peak has been found within this range that exceeds a lower secondary threshold, then it is used to calculate the present Tx. Otherwise, the previously detected second peak is used to calculate Tx.
Each Tx estimate is used to initiate the generation of a single cycle of a cosine signal. The sequence of cosine cycles forms a signal that is matched to the auditory abilities of profoundly hearing impaired listeners and represents both the fundamental frequency pattern and the on-off voicing pattern of the speech input. The MLP fundamental frequency extractor and the buffer processor introduce a delay of 35 ms (MLPa) or 30 ms (MLPb) between the input and output.
In the operation of the SiVo-3, each period estimate is used to control the generation of a single period of a cosine wave. This introduces a further delay of Tx(in the range 0.5 to 30 ms). Studies of aided lip-reading in normal listeners have shown that if the time delay of a fundamental frequency signal compared to the original speech is within 40 ms, there is no affect on performance, and that delays up to 80ms produce only slight and non-significant decreases in performance (McGrath & Summerfield, 1985).
3. Evaluation 1. UNIX 'C' implementation of MLPa:
performance in quiet and noise
This first study concerns the performance of an off-line 'C' language
implementation of MLPa that was developed prior to the real-time
version in TMS320C50 assembly language.
3.1 Comparison methods
In this section, the MLPa algorithm is compared to two standard
methods. In each case, the implementations were those of the ILS
signal processing software library (ILS, 1986).
The chosen methods were the "cepstrum" technique (Noll, 1967), and the "Simple Inverse Filter Tracking " or SIFT algorithm (Markel, 1972). While there are more recent algorithms in existence that may give superior performance (e.g. Secrest and Doddington, 1983) these standard Cepstral and SIFT methods have the merit be being widely used and documented. The ILS Cepstral analysis was applied with the default settings for a 10 kHz sample rate; the analysis window was 32 ms in duration. The default parameters for the ILS SIFT analysis were also used. Here the effective analysis window was 50 ms, with smoothing of the Fx estimates applied over four successive windows.
3.2 Test data
The test data, like the training data, contain both speech and
Laryngograph waveforms. The laryngograph signal was used to derive
the reference fundamental frequency for comparison with the estimates
from each algorithm. Four speakers were recorded, two male and
two female. They were different speakers to those recorded for
the training data. Each read a standard speech passage, "The
North Wind and the Sun".
The test data included noisy speech produced in the same way as the noisy training speech data, with S/N of 15 dB and 10 dB. The test speech data had a sampling rate of 10 kHz.
The fundamental frequency and fundamental period estimates from the algorithms were all expressed in terms of fundamental frequency. The Fx sample rate was 200 Hz for the MLPa output, and 100 Hz for the other methods. The Fx data from the MLP algorithm were resampled to 100 Hz before comparisons were made.
3.3 Voicing classification performance
One basic parameter of fundamental frequency extraction algorithms,
especially in this SiVo-3 application, is the voiced-unvoiced
decision. This decision has two error components, where voiced
frames are wrongly classified as unvoiced, and where unvoiced
frames are incorrectly classified as voiced. These two errors
for the three algorithms are shown in Figure 2 through Figure 4.
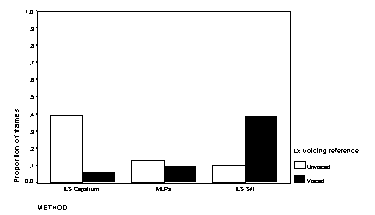
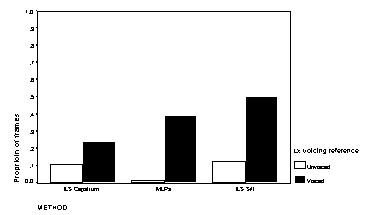
| Figure 2Voicing classification errors in quiet | Figure 3 Voicing errors at 15 dB S/N |
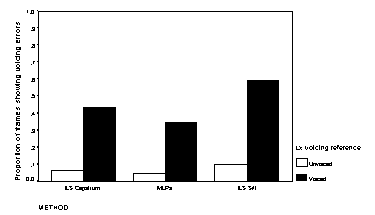
Figure 4:
Voicing errors at 10 dB S/N
The voicing errors in each case show a tendency for more false alarms as the signal-to-noise ratio deteriorates; this is probably an appropriate bias in a hearing aid to supplement lipreading, where the user may be able to ignore false alarms that occur during (visible) pauses in speech
An overall measure that combines both sources of error in voicing classification is the signal detectability index d' (Peterson et al., 1954). Voicing detection performance measured by d' is shown in Figure 5. This measure makes clear that the MLPa algorithm is the most effective for voicing classification, especially in quiet. The Sift algorithm is poorer as a result of the higher number of unvoiced frames that it classifies as voiced, while the Cepstral analysis is poorer than the MLP in missing a higher number of voiced frames.
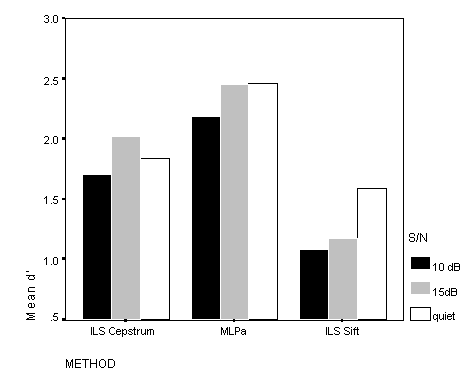
Figure 5. Voicing detection accuracy measured by d'
3.4 Accuracy of fundamental frequency extraction
For all samples of the reference Fx pattern that were classified
as voiced according to the laryngograph reference, Fx errors were
computed for each algorithm. Errors of greater than one octave
are designated gross errors. The proportion of frames where gross
errors occurred is shown in Figure 6 through to Figure 8.
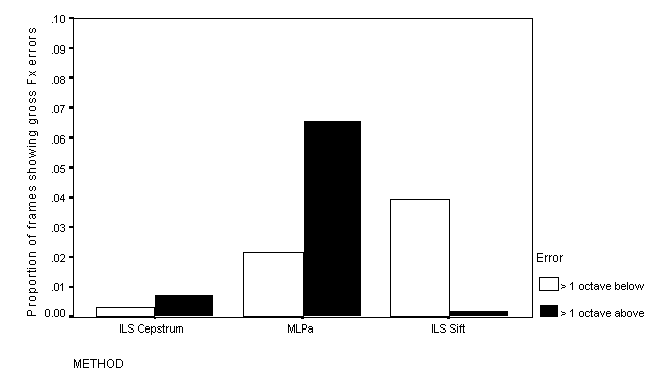
Figure 6: Proportion of frames of voiced speech showing Fx errors for quiet speech
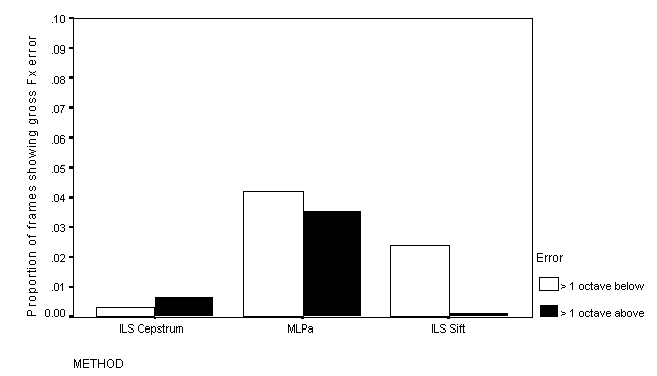
Figure 7: Proportion of frames showing gross Fx errors: S/N = 15 dB
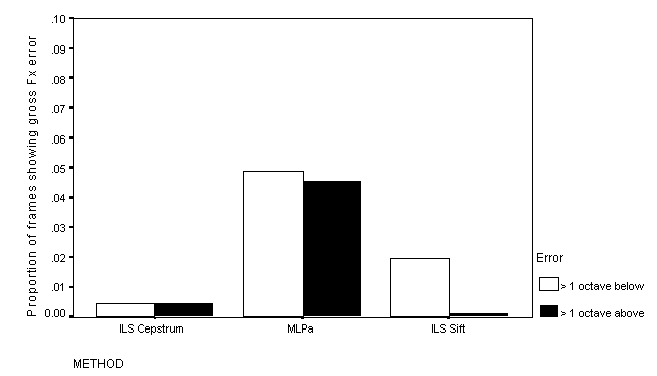
Figure 8: Proportion of frames showing gross Fx errors: S/N = 10 dB
All of the methods show relatively low rates of gross Fx error. The rate is markedly higher for MLPa than for either the Cepstral or the Sift method, but never exceeds 5%.
The distributions of Fx errors of one octave and less are shown in Figure 9 through Figure 11.
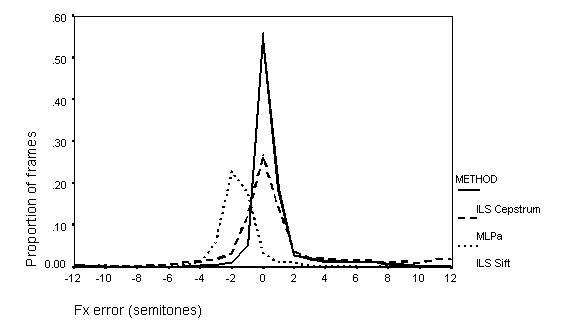
Figure 9: Distribution of Fx errors in quiet. Solid line - Cepstrum; dashed line - MLPa; dotted line - SIFT.
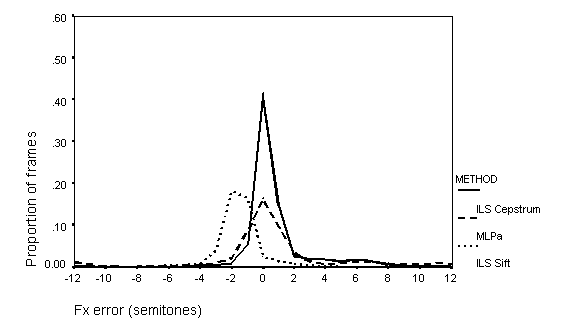
Figure 10. Distribution of Fx errors: 15 dB S/N
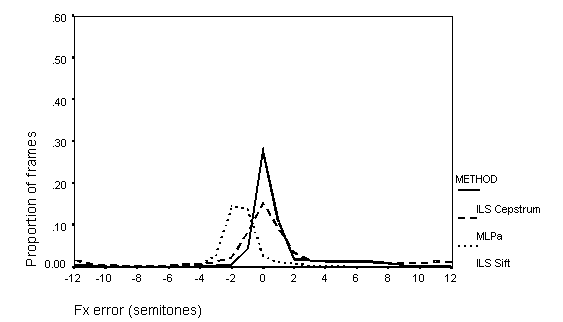
Figure 11: Distribution of Fx errors: 10 dB S/N
The distributions of errors of one octave and less show that the ILS Cepstral method is always more accurate than either the SIFT or the MLPa algorithms in the precision of Fx estimation. However, the error distribution from the Cepstral method is much more affected by the presence of noise than are the other methods, and at the poorest signal-to-noise ratio, the distribution is much more similar to that from the SIFT and MLPa algorithms. The SIFT and MLPa algorithms show very similar distributions of Fx error, except that the SIFT Fx estimates tend to be between one to two semitones too low. Such a constant error would not be important for an auditory supplement to lipreading.
3.5 Conclusions
The off-line prototype MLP has been shown to give superior performance
in voicing classification than either reference method, both in
quiet and in noise. The Fx estimation accuracy of the OSCAR MLP
is less accurate than that of the Cepstral analysis both in terms
of gross and less extreme Fx errors, but this difference is relatively
small at poorer signal-to-noise ratios. The OSCAR MLP is more
accurate than the Sift method in respect of less extreme Fx errors.
The gross Fx error rate of the OSCAR MLP is larger than that of
the two reference algorithms, but is still relatively low.
Since in this application it is the accuracy of voicing detection that is of primary significance over accuracy of Fx estimation, the results confirm that the MLP is likely to be appropriate for the SiVo application.
4. Evaluation 2. Real-time MLP running on SiVo-3
speech processor: performance in quiet
To evaluate the MLP algorithms running in real-time on the SiVo-3
device, simultaneous recordings were made (Alesis A-DAT digital
tape recorder) of the following input and output and reference
signals.
Recordings were made in a quiet room with a microphone distance of about 1 m. The microphone was that built into the case of the SiVo-3 unit. Recordings were taken from four female and four male talkers who had not been used for the MLP training data.
Evaluations are based on the voicing and fundamental frequency patterns sampled in 5 ms frames, compared to the voicing and fundamental frequency pattern derived from the Laryngograph waveform. Comparison data were obtained from the same speech samples using the Cepstral and SIFT fundamental frequency analysis algorithms provided in the ILS signal processing package. These were the same as the ILS reference methods used in the earlier evaluation of the Unix 'C' implementation of MLPa.
For each sample recording, the speech and laryngograph waveforms, and the outputs of the MLPa and MLPb algorithms after post-processing, were digitally acquired using a four-channel PCLx card and software from Laryngograph Ltd. The data were then copied to a Sun Unix computer system and processed using the Speech Filing System (SFS) software (Huckvale, 1996) to extract voicing and fundamental frequency patterns. Unvoiced frames were assigned a fundamental frequency of zero Hz.
These data were finally analysed using SPSS for Windows to make the following comparisons for each sample recording
4.1 Cross-correlations of estimated Fx with reference
Cross-correlation indicated that the time-alignment of the MLP
output signals was correct - the delays involved in the MLP and
post-processing buffer were 30 ms for MLPa and 35 Ms for MLPb.
The ILS algorithms produced correctly time-aligned output without
the need for correction.
4.2 Voiced/unvoiced classification
Voicing classification performance has been measured in two ways.
Firstly, by the cross-correlation of the voiced/unvoiced classification
frame-by-frame of the algorithm output with the reference from
the Laryngograph. Secondly, by the signal detection statistic
d'. Correlations and d' were compared between algorithms by pairwise
t tests using a significance criterion of p=0.05.
The correlation comparisons are shown in Figure 12. Across the
eight talkers, the correlation with the reference voicing pattern
was not significantly different between MLPa and MLPb. The correlations
from MLPa were not significantly different to those from the Cepstral
analysis, but MLPb was significantly less accurate than the Cepstral
analysis. The correlations from the Sift analysis were significantly
lower than those from all of the other three algorithms.
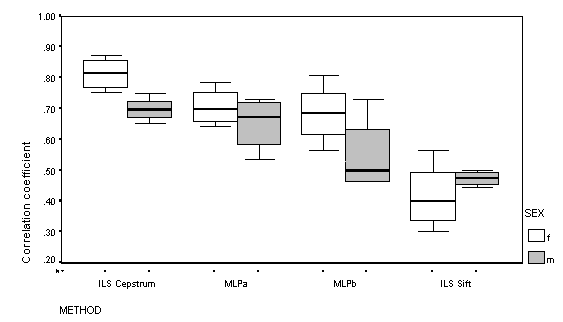
Figure 12: Correlation of frame-by-frame voicing classification with Lx reference. The box and whisker plot shows the median value as a bar, the 75% range as the box, and the extreme values as the whiskers.
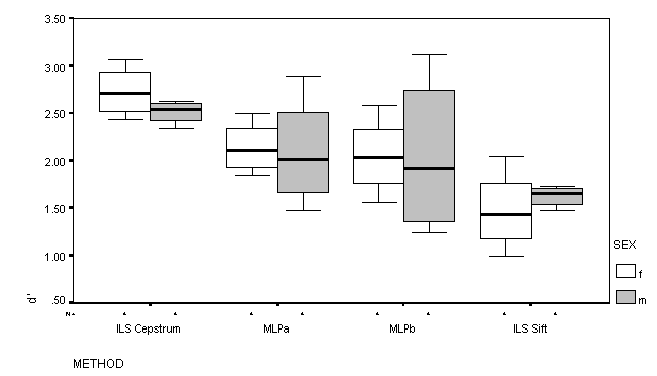
Figure 13: Voicing detection performance measured by d'
The d' measure (see Figure 13) showed no substantial differences between the MLP algorithms. Voicing detection by the Cepstral analysis was significantly higher than for the MLP methods, and voicing detection by Sift was significantly worse than any of the other methods.
4.3 Scatter-plots of estimated and reference Fx
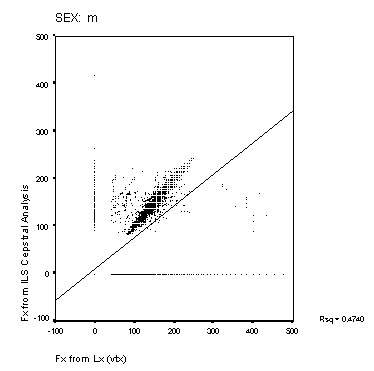
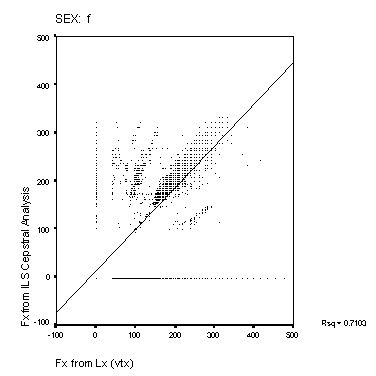
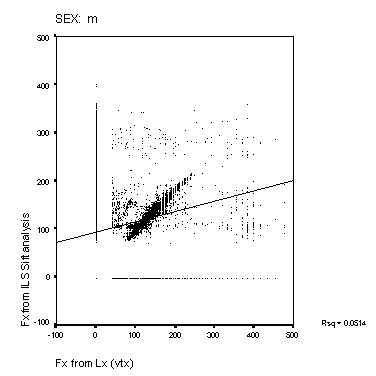
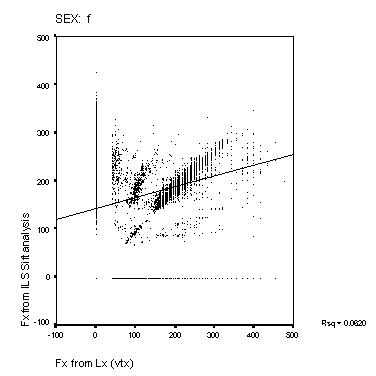
Figure 14: Scatter-plots of reference Fx and estimated
Fx from the Cepstral and Sift algorithms. The panels show data
from the male and female speakers from each of the four algorithms.
The solid line is a linear regression fit for the data. The squared
correlation for each fit is shown to the right of each panel.
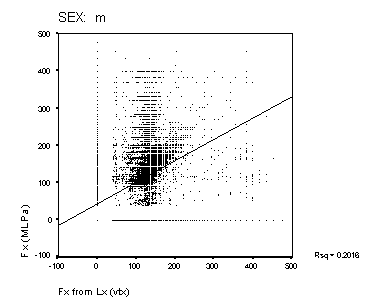
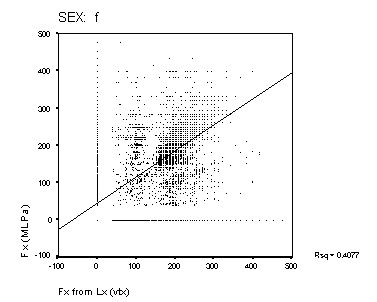
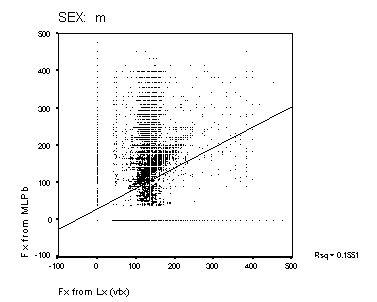
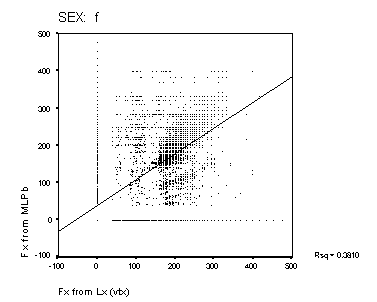
Figure 15: Scatter-plots of reference Fx and estimated Fx from MLPa and MLPb. The panels show data from the male and female speakers from each of the four algorithms. The solid line is a linear regression fit for the data. The squared correlation for each fit is shown to the right of each panel.
Scatter-plots of reference compared to estimated Fx are shown in Figure 14 and Figure 15. A perfect performance would result in a scatter plot where all points lay on a straight line of unit slope. None of the methods approach this level of accuracy. The Cepstral analysis provides the most accurate result, and the Sift method the poorest. MLPa is rather better than MLPb. Both MLP's show a tendency to overestimate higher fundamental frequencies for male speakers. The squared correlations shown in the figure represent a measure of goodness of Fx estimation that includes the effect of voicing error (with Fx arbitrarily valued at zero for unvoiced frames). This measure is higher generally for the female speakers than for male speakers. The algorithms rank as Cepstrum > MLPa > MLPb > Sift for this measure.
4.4 Distribution of Fx errors
Fx errors are shown here by histograms displaying the ratio between
the estimated Fx value from each algorithm and Fx from the laryngograph
reference. Frames of data where the Lx reference is unvoiced are
not included, but frames where the algorithms fail to detect voicing
are.
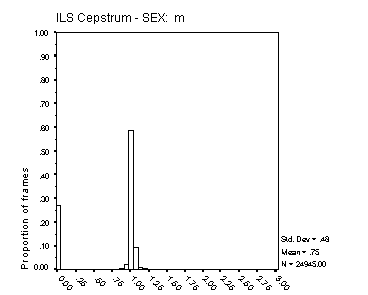
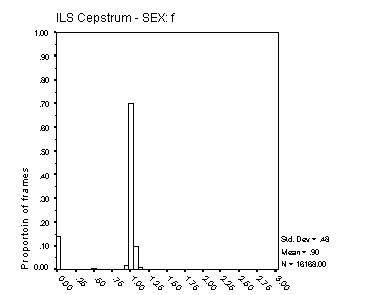
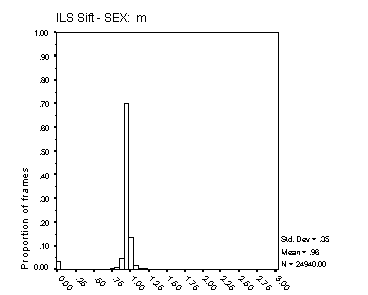
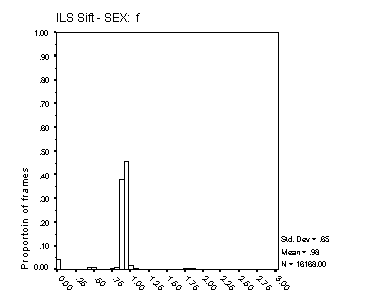 Figure 16: Distribution of Fx estimates. The four panels
show data for male and female speakers from the ILS Cepstral and
Sift algorithms. The data are for all frames where the Lx reference
was voiced, and include frames that the algorithms classified
as unvoiced for which the ratio is zero. Each bar represents a
range of 6.25%. The algorithm is indicated on the abscissa, and
the speaker sex above each panel. The mean and standard deviation
of the displayed distribution is shown to the right of each panel,
together with the total number of frames analysed.
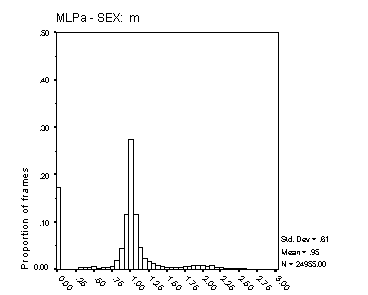
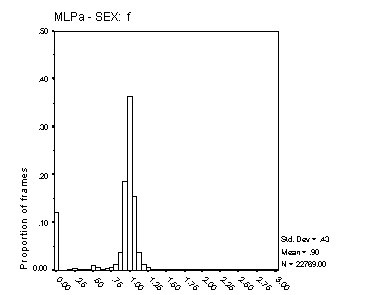
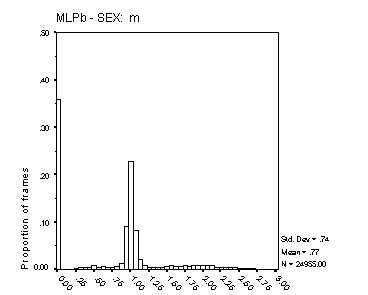
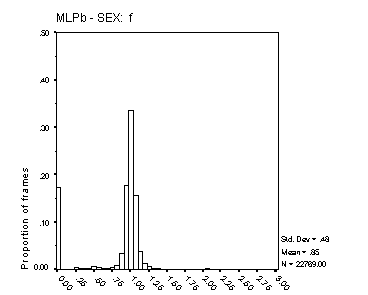
Figure 17: Distribution of Fx estimates. The four panels show data for male and female speakers from the MLPa and MLPb algorithms. The data are for all frames where the Lx reference was voiced, and include frames that the algorithms classified as unvoiced for which the ratio is zero. Each bar represents a range of 6.25%. The algorithm is indicated on the abscissa, and the speaker sex above each panel. The mean and standard deviation of the displayed distribution is shown to the right of each panel, together with the total number of frames analysed.
The histograms in Figure 16 and Figure 17 reflect both the spread of estimated Fx about its true value, and the proportion of voiced frames classified as unvoiced. In precision of Fx estimation, the Cepstral method is clearly superior. The precision of Fx estimates from MLPa is reasonable, with some 70% of frames estimated with an error of 6.25% or less for male speech and around 50% with this degree of error for female speech. The broader Fx distribution from MLPa with female speech reflects the inherent limit of 0.5 ms to the precision of its Tx estimates. Female Fx for these speakers is typically between 200 and 300 Hz, but extends well beyond 400 Hz on occasion. A Tx precision of 5 ms translates to an Fx precision of 10% at 200 Hz and 20% at 400 Hz.
For male speech, MLPa is clearly superior to MLPb in regard to this measure.
4.5 Conclusions of Evaluation 2.
The MLPa algorithm is, on the evidence of the correlation of the
estimated voicing pattern with the Lx reference, and accuracy
of Fx estimation, superior to MLPb. This is most evident for male
speech. In the accuracy of voicing detection, MLPa approaches
the performance of the Cepstral reference, and both MLPs are superior
to the Sift method.
4.6 Comparisons between Evaluations 1 and 2
Comparable measures are only available for voicing classification,
since fundamental frequency estimation errors were processed in
different ways in the two evaluations. It must be noted that the
speech materials were also different between the two studies.
The d' measure of voicing classification from MLPa is rather similar
for speech in quiet in both evaluations; the overall d' in evaluation
1 was around 2.5, while for the real-time algorithm, d' was n
the range 2.0 to 2.5. For the Cepstral method, d' for voicing
classification was higher for the recordings of evaluation 2 (2.5
to 3.0) than from the recordings used in evaluation 1, where in
quiet, d' was 1.8. This may reflect that the recordings used in
evaluation 1 were inherently less quiet than those used in evaluation
2. It seems, therefore, that the different ranking of the Cepstral
method and MLPa for voicing classification is likely to be due
more to differences in the recorded materials and does not indicate
a significant difference in performance between the prototype
off-line and real-time versions of MLPa.
5. Overall conclusions
Both these evaluations, covering a UNIX and a real-time TMS320C50
implementation of the OSCAR MLP fundamental frequency extractor,
indicate that its performance is likely to be appropriate for
the SiVo-3 application. Voicing detection by the MLPa algorithm
is similar to that of the Cepstral analysis, and much superior
to that of the Sift algorithm. The results indicate that MLPa
is, as intended, able to maintain much of its performance in levels
of noise that are problematic for profoundly hearing impaired
listeners. Evaluation 2 makes clear that MLPa is superior to the
preceding MLPb on all criteria. Only the MLP algorithm is able
to provide cycle-by-cycle F0 estimates, which gives
it a further advantage over the other methods in this hearing
aid application.
5.1 Significance of Fx and voicing errors
The significance of the errors of Fx estimation and
voicing classification of these algorithms for a device that supplements
lipreading can be assessed by reference to user-based assessments
of the analysis method of the OSCAR field trials (van Son et al.,
1997). Here tests in profoundly hearing impaired users of SiVo-3
compared an ideal extraction of the voicing pattern and Fx
based on a recorded laryngograph signal to the use of MLPa to
extract this information from speech in quiet. Speech perception
using the analytic processing of MLPa did not differ significantly
from a the condition in which the laryngograph signal was used
to control the voicing and fundamental frequency information from
the SiVo-3 aid. This suggests that profoundly impaired listeners
are not highly sensitive to such errors. It has been suggested
that high accuracy may be necessary in Fx based lipreading
aids for optimal performance (Hnath-Chisolm and Boothroyd (1992),
but these results were based on normally-hearing listeners who
apparently are much more sensitive to such errors than are profoundly-impaired
listeners.
5.2 User results for speech in noise
A second outcome of the OSCAR user trials has been the finding
that speech perception in noise using the analytic processing
of MLPa is little affected by the presence of noise at S/N up
to 5 dB. This is consistent with the objective finding here that
the voicing classification and Fx extraction performance
of MLPa is little affected by noise.
Acknowledgements
Supported by the TIDE project OSCAR (TP1217) with funding from
CEC DGXII (C5). We are grateful to John Walliker and Mark Huckvale
for assistance in the development and training of the MLPs, and
to both John Walliker and David Howells for their contribution
to the real-time code of the SiVo-2 and SiVo-3. We are also grateful
to Roel Smits for constructive comments on an earlier draft MS.
References
Ball, V., Faulkner, A., and Fourcin, A. J. (1990). "The effects
of two different speech coding strategies on voice fundamental
frequency control in deafened adults," Br. J. Audiol.
24, 393-409.
Barnard E., Cole R. A., Vea M. P., and Alleva F. A., "Pitch detection with a neural-net classifier", IEEE Trans. Acoustics, Speech, Signal Processing, Vol. 39, No. 2, pp 298-307, Feb., 1991.
Chan L. W., and Fallside F., "An adaptive training algorithm for back propagation networks", Computer Speech and Language, 205-218, 1987.
Chester D. L., "Why two hidden layers are better one", Proceedings of the International Joint Conference on Neural Networks, Vol. 1, pp 265-268, Erlbaum, 1990.
Denzler J., Kompe R., Kiebling A., Niemann H., and Noth E., "Going back to the source: inverse filtering of the speech signal with ANNs", Proceedings of Eurospeech, pp 111-114, Berlin, 1993.
Fourcin A. J., and Abberton E., "First applications of a new laryngograph", Medical and Biological Illustration, Vol. 21, pp 172-182, 1971.
Hess, W. (1983) "Pitch Determination of Speech Signals" Springer-Verlag, Berlin.
Hnath-Chisolm, T. and Boothroyd, A. (1992) "Speechreading enhancement by voice fundamental frequency: The effects of F0 contour distortions". J. Sp. Hear. Res., 35, pp 1160-1168.
Howard, D. M. (1989) "Peak-picking fundamental frequency estimation for hearing prostheses" J. Acoust. Soc. Am., 86, pp 902-910
Howard, I. S. and Huckvale, M. A. (1988) "Speech fundamental period extraction using a trainable pattern classifier" In. Proc. Speech '88: 7th FASE Symposium (Inst. Acoust. Edinburgh), pp129-136.
ILS (1986). Interactive Laboratory System, Signal Technology Inc.
Makhoul J, El-Jaroudi A, and Schwartz R, "Formation of disconnected decision regions with a single hidden layer", Proceedings of the International Joint Conference on Neural Networks, Vol. 1, pp 455-460, 1989.
Markel, J.D., "The SIFT algorithm for fundamental frequency estimation", IEEE Trans. AU-20, 367-377, 1972.
McGrath M and Summerfield Q (1985) Intermodal-timing relations and audio-visual speech recognition by normal-hearing adults", J. Acoust. Soc. Am., 77, 678-685.
Noll, A.M., "Cepstrum pitch determination" J. Acoust. Soc. Amer., 41, 293-309, 1967.
Peterson, W. W., Birdsall, T. G. and Fox, W. C. (1954). The theory of signal detectability. Inst. Radio Engineers Transactions, PGIT-4, 171-212
Rumelhart D. E., Hinton G., and Williams R., "Learning representations by back-propagating errors", Nature, Vol. 323, pp. 533-536, 1986.
Rumelhart D, McClelland J and the PDP Research Group (1988) Parallel Distributed Processing, The MIT Press, Cambridge, Massachusetts.
Secrest, B.G., and Doddington, G.R. (1983). "An integrated pitch tracking algorithm for speech systems," ICASSP 83, 1352-1355, Boston.
van Son, N., Beijk, C, and Faulkner, A. (1997), "Final report of Workpackage E: Field trials", in preparation. Ref. OSCAR-UCL-1997-WPE
Walliker, J. R. and Howard, I. S. (1990) The implementation of a real time speech fundamental period algorithm using multi-layer perceptrons. Speech Communication, 9, 63-71.
© Andrew Faulkner and Jianing Wei
 for comments