SFS/ESection Help File
| Program: | Vs 2.7 |
| Help file: | Vs 2.7 |
Contents: Internet links:
¤Controls
¤Analysis
¤Learn more
¤Bug reports
¤Copyright
¤ESection Home
¤SFS Home
¤Speech &
Hearing Home
¤UCL Phonetics
and Linguistics
ESection is a program to display a number of different frequency analyses of a speech signal. For a particular time in a speech recording, or over a given range of times, the program can display a spectral cross-section, a linear prediction spectrum, an autocorrelation or a cepstral analysis. Esection can display the input speech signal as a waveform or a spectrogram, and it automatically estimates fundamental and formant frequency values for each cross-section.
ESection is a simple application that is complete in itself but which is also designed to be compatible with the Speech Filing System (SFS) tools for speech research.
Controls
Toolbar
- New. Resets the display to a standard setting.
- Open. Opens an existing SFS or Windows audio file for analysis.
- Save. Saves the audio to an SFS or Windows audio file.
- Print. Reproduces a copy of the current display on the printer. You can add your own title to the printout.
- Record. Record a new input signal for analysis.
- Replay. Replay the current input waveform between the cursors.
- Stop. Halt replay.
- Waveform. Display the speech as a waveform.
- Wide-band. Display the speech as a wide-band spectrogram.
- Narrow-band. Display the speech as a narrow-band spectrogram.
- Scroll Left. Scroll the waveform displays by one screen earlier in the waveforms.
- Zoom In. Zoom in to the area marked by the left and right cursors.
- Zoom Out. Zoom out to the display time used at the last zoom in.
- Scroll Right. Scroll the waveform displays by one screen later in the waveforms.
- Source Spectrum. Display the estimated source (or inverse filtered) spectrum.
- Filter Response. Display the estimated vocal tract filter response (LPC spectrum).
- Output Spectrum. Display the speech spectrum.
- Autocorrelation. Display the autocorrelation function.
- Cepstrum. Display the cepstrum function. The cepstrum is the spectrum of the log amplitude spectrum of the signal.
Other menu options
- Edit/Copy Display. Copy a bitmap image of the screen into the clipboard.
- Signal/Configure Analysis. Change the default signal analysis parameters. Pre-emphasis switches on a +6dB/octave filter to compensate for the slope of the glottal spectrum. The window time is used to specify the analysis window size when only one cursor is used on the screen, or where spectral averages are calculated. The order of the LP analysis can be set automatically from the sample rate, can be estimated automatically from the complexity of the spectrum, or can be set to a specfic value.
- View Formant Table. Display a summary of the formant frequency values estimated from the Filter.
- View Harmonic Table. Display a summary of the harmonic frequency values estimated from the signal spectrum.
- View/Grids. Turn the backgound spectrum grid lines on and off.
- View/Overlay spectrum with Frequency response. Cobines the output spectrum and frequency response graphs on one display.
- View/Remember this analaysis. Remembers the current analysis and displays it on subsequent graphs - useful for comparisons within a signal.
Mouse operation
On the upper display the left mouse button sets the position of the left (start time) cursor. The right mouse button sets the position of the right (end time) cursor. When one cursor is present, analysis is performed on a window around this time. The size of this window is set in the Configure Analysis dialog. When two cursors are present, analysis is performed on the signal region between the cursors. When a large region of the signal is selected, the program calculates the average spectrum across the region by averaging multiple analyses. The cursor positions are also used to specify which area to expand in the Zoom-in command.
Keyboard shortcuts
The following keyboard shortcuts are provided:
| Key | Action |
|---|---|
| L | Scroll Left |
| R | Scroll Right |
| Z | Zoom In |
| U | Zoom Out (Up) |
| T | Zoom Out to Top |
| M | Remember analysis |
| [space] | Replay Signal |
| [<−] | Shift left cursor left |
| [−>] | Shift left cursor right |
| [SHIFT/<−] | Shift right cursor left |
| [SHIFT/−>] | Shift right cursor right |
Analysis
| Analysis | Description |
|---|---|
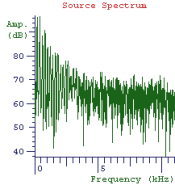 | Source Spectrum. Shows the estimated spectrum of the source signal entering the vocal tract when this sound was produced. The source estimate is found by "inverse filtering" the signal, that is, sending the signal through the inverse of the estimated filter. |
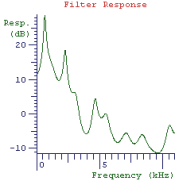 | Filter Response. Shows the response of the estimated vocal tract filter that produced this sound. The filter is estimated on the assumption that the vocal tract is a simple unobstructed tube, closed at the glottis and open at the lips. The filter will not be correct when these conditions are not met. The estimated formant frequencies shown in the status bar are calculated from the locations of peaks in this filter. |
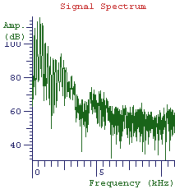 | Signal Spectrum. Shows the spectrum of the signal. This is generated from a pre-emphasised and windowed section of the signal. |
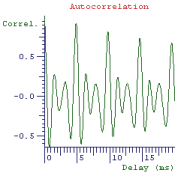 | Autocorrelation. Shows the autocorrelation of the signal. The autocorrelation function shows how well the signal matches itself as a function of some delay. Typically, a good match is achieved when the signal is delayed at a time which corresponds to the fundamental repetition period. |
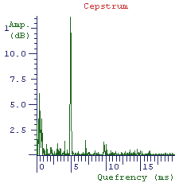 | Cepstrum. Shows the cepstrum of the signal. The cepstrum is the spectrum of the log magnitude spectrum of the signal. This analysis highlights repetition in the signal spectrum and provides a direct means of estimating the spacing between harmonics in the spectrum and hence the fundamental frequency. The estimated fundamental frequency shown in the status bar is calculated from the locations of peaks in the cepstrum. |
Want to learn more?
If you find the study of speech interesting and would like to know more, why not visit the Internet Institute of Speech and Hearing at www.speechandhearing.net ? There you will find tutorials, reference material, laboratory experiments and contact details of professional organisations.
Bug reports
Please send suggestions for improvements and reports of program faults to sfs@pals.ucl.ac.uk.
Please note that we are unable to provide help with the use of this program.
Copyright
ESection is not public domain software, its intellectual property is owned by Mark Huckvale, University College London. However ESection may be used and copied without charge as long as the program and help file remain unmodified and continue to carry this copyright notice. Please contact the author for other licensing arrangements. ESection carries no warranty of any kind, you use it at your own risk.