
SFS/EFxHist Help File
| Program: | Vs 2.0 |
| Help file: | Vs 2.0 |
Contents: Internet links:
¤Controls
¤Analysis
¤Statistics
¤Learn more
¤Bug reports
¤Copyright
¤EFxHist Home
¤SFS Home
¤Speech &
Hearing Home
¤UCL Speech, Hearing & Phonetic Sciences
EFxHist is a program designed to generate statistics of larynx excitation from a recording of a speech signal made with a simultaneous Laryngograph (Lx) signal. EFxHist determines the points of larynx closing and opening from the Lx signal then generates various analyses such distribution of fundamental frequency, distribution of close quotient, jitter and shimmer.
EFxHist is a simple application that is complete in itself but which is also designed to be compatible with the Speech Filing System (SFS) tools for speech research.
Controls
Toolbar
- New. Resets the display to a standard setting.
- Open. Opens an existing SFS or Windows audio file for analysis.
- Save Statistics. Saves the raw distribution data in a format compatible with Excel and statistics programs.
- Print. Reproduces a copy of the current display on the printer. You can add your own title to the printout.
- Dx1. Display histogram of all Tx values.
- Dx2. Display histogram of regular Tx values.
- Cm1. Display cumulative histogram of all Tx values.
- Cm2. Display cumulative histogram of regular Tx values.
- Qx. Display histogram of close quotient Tx values.
- Jx. Display histogram of Tx jitter values.
- Shx. Display histogram of Tx shimmer values.
- Hx. Display histogram of harmonic-to-noise ratio.
- LTS. Display long-term spectrum.
- Cx. Display scatter-plot of Tx pairs.
- Phx. Display scatter-plot of Tx-Energy pairs (Phonetogram).
- StV. Display table of short-term statistics (Vowel).
- StP. Display table of long-term statistics (Passage).
Other menu options
- Edit/Copy Display. Copies display as bitmap into clipboard.
- Edit/Copy Stats Table. Copies text of summary statistics table to clipboard. Choose "Csv" format when pasting this into Excel or statistics program.
- View/Overlay Dx1 & Dx2. Overlay Dx1 & Dx2 histograms (using different colours), and also overlay Cm1 & Cm2 cumulative histograms.
Analysis Descriptions
| Analysis | Description |
|---|---|
Dx1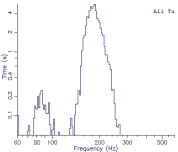 |
Dx1 is a histogram of all the pitch periods found in the recording, distributed acording to their fundamental frequency. |
Dx2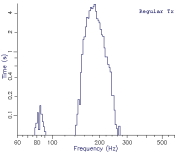 |
Dx2 is a histogram of all the regular pitch periods found in the recording, distributed acording to their fundamental frequency. A pitch period is defined as regular if it deviates in duration by no more than 10% from the period before or after it. |
Cm1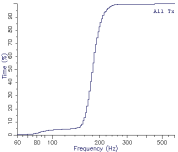 |
Cm1 is a cumulative histogram of all the pitch periods found in the recording, distributed acording to their fundamental frequency. 100% on the graph corresponds to the total voice time. |
Cm2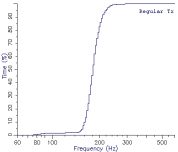 |
Cm2 is a cumulative histogram of all the regular pitch periods found in the recording, distributed acording to their fundamental frequency. 100% on the graph corresponds to the total regular time. |
Qx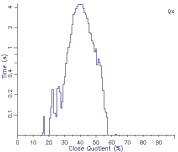 |
Qx is a histogram of the closed quotient values found in the recording. The closed quotient is an estimate of ther pecentage time the vocal folds remained closed in each pitch period. It is found from the Laryngograph signal. |
Jx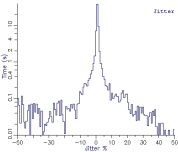 |
Jx is a histogram of the jitter measurements made from the recording. Jitter is a measure of period-to-period fluctuations in duration from the mean taken over 5 pitch cycles. |
Shx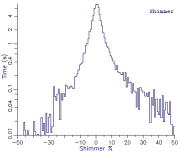 |
Shx is a histogram of the shimmer measurements made from the recording. Shimmer is a measure of period-to-period fluctuations in speech signal amplitude from the mean taken over 5 pitch cycles. |
Cx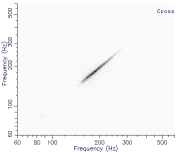 |
Cx is a scatter plot of pairs of adjacent pitch periods, plotted according to the fundamental frequency of each period. The number of periods in the recording found at each frequency co-ordinate is plotted on a grey scale. |
Phx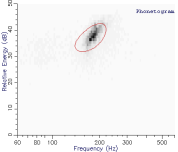 |
Phx is a scatter plot of the frequency and energy corresponding to each pitch period in the recording. The number of periods in the recording found at each frequency-energy co-ordinate is plotted on a grey scale. A 2D gaussian is fitted to the distribution and the 90% contour is overlaid on the graph. The gaussian is calculated using linear hertz frequencies. |
HNR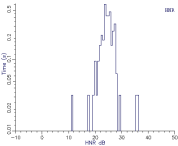 |
HNR is a distribution of the harmonic-to-noise ratio value measured over all voiced regions. |
LTS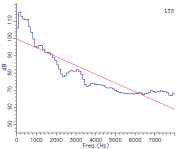 |
LTS is a plot of the long-term average spectrum of the whole speech signal. |
Vowel Stats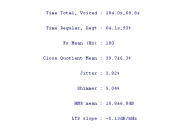 |
The vowel statistics table lists some common summary statistics used when analysing voice qulity from single vowel sounds. Further descriptions of these can be found below. |
Passage Stats |
The passage statistics table lists some common summary statistics used when analysing pitch distributions from an extended passage. Further descriptions of these can be found below. |
Summary Statistics
| Analysis | Description |
|---|---|
| Total Time | Total duration of recording |
| Voice Time | Total duration of voiced speech |
| Regular Time | Total duration spent in regular voicing |
| Regularity% | Percentage time spent in regular voicing |
| Close Quotient Mean | Average closed quotient percentage |
| Close Quotient StdDev | Closed quotient standard deviation |
| Jitter Mean | Average absolute jitter |
| Shimmer Mean | Average absolute shimmer |
| HNR Mean | Average harmonic-to-noise ratio |
| LTS Slope | Slope of long-term spectrum |
| Fx Mode | Most common Fx |
| Fx Mean | Average Fx (regular only) |
| Fx StdDev | Standard deviation of Fx (regular only)x |
| Fx Coefficient of Variance | Coefficient of variation of Fx distribution (regular only) |
| Fx Skew | Skew of Fx distribution (regular only) |
| Fx Kurtosis | Kurtosis of Fx distribution (regular only) |
| n% Percentile | Frequency values from percentiles of the Fx distribution (regular only) |
Want to learn more?
If you find the study of speech interesting and would like to know more, why not visit the Internet Institute of Speech and Hearing at www.speechandhearing.net ? There you will find tutorials, reference material, laboratory experiments and contact details of professional organisations.
Bug reports
Please send suggestions for improvements and reports of program faults to sfs@pals.ucl.ac.uk.
Please note that we are unable to provide help with the use of this program.
Copyright
EFxHist is not public domain software, its intellectual property is owned by Mark Huckvale, University College London. However EFxHist may be used and copied without charge as long as the program and help file remain unmodified and continue to carry this copyright notice. Please contact the author for other licensing arrangements. EFxHist carries no warranty of any kind, you use it at your own risk.