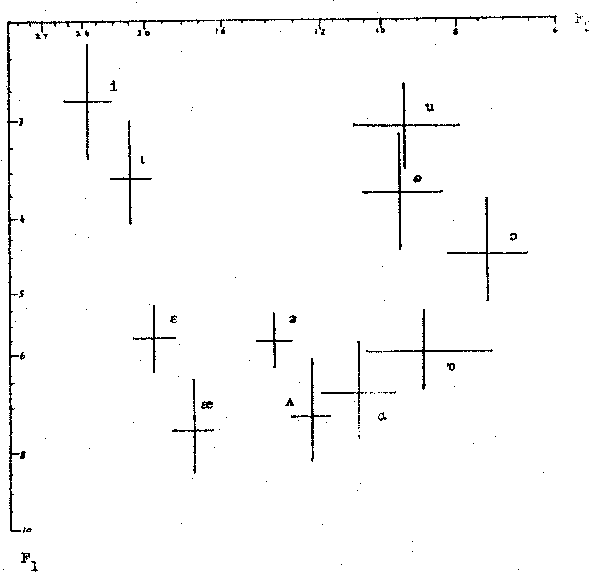
MEAN and DISPERSION of FORMANT FREQUENCIES: plot of F1 vs. F2.
Lines extend one standard deviation to each side of mean value.
(Logarithmic scale calibrated in hundreds of cycles per second)
Fig. 4.
MEAN and DISPERSION of FORMANT FREQUENCIES: plot of F1 vs. F2.
Lines extend one standard deviation to each side of mean value.
(Logarithmic scale calibrated in hundreds of cycles per second)
Fig. 4.