

Abstract
Multi-channel cochlear implants typically present spectral information
to the wrong "place" in the auditory nerve array, because
electrodes can only be inserted part of the way into the cochlea.
In effect, the spectral information has been shifted to nerves
that typically carry higher frequency information. Although it
is known that such spectral shifts cause large immediate decrements
in performance, the extent to which listeners can adapt to such
shifts has yet to be investigated. Here, we have simulated the
effects of a four-channel implant in normal listeners, and tested
performance both with unshifted spectral information, and with
the equivalent of a 6.46 mm basalward shift on the basilar membrane
(corresponding to frequency shifts of 1.3-2.9 octaves, depending
on frequency). Three speech identification tests were employed,
involving vowels, consonants and sentences. As expected, the unshifted
simulation led to relatively high levels of performance (e.g.,
64% mean words in sentences correct) whereas the shifted simulation
led to very poor results (e.g., 1% mean words in sentences
correct). However, performance improved significantly with even
small amounts of experience with the shifted signals. After just
nine 20-min sessions of connected discourse tracking (3 hours
of experience), performance on the intervocalic consonant test
had increased to be statistically indistinguishable from performance
with unshifted (but still processed) speech. Vowel performance
increased significantly, although shifted performance did not
reach that obtained with the unshifted speech. The performance
on sentences had increased to 30% correct, and listeners were
able to track connected discourse of shifted signals without lipreading
at rates up to 40 words per minute. Although we do not know if
a complete adaptation to the shifted signals is possible, it is
clear that short-term experiments seriously exaggerate the long-term
consequences of such spectral shifts.
1. Introduction
Although multi-channel cochlear implants have proven to be a great
boon for profoundly and totally deaf people, there is still much
to be done in improving patient performance. One barrier to better
results may be the fact that spectral information is presented
in the wrong "place" of the auditory nerve array, due
to the fact that electrodes can only be inserted part of the way
into the cochlea. The most apical electrode of an array that is
25 mm long, and fully inserted into the cochlea, will reach auditory
nerve fibres that typically carry information around 500 Hz (according
to the equation presented by Greenwood, 1990). Shallower insertions
are extremely common, so for example, a 20 mm insertion would
reach a region typically tuned to about 1.1 kHz. As all multi-channel
implants make use of a tonotopic presentation of acoustic information,
the net effect of such misplacement is that spectral information
is shifted to nerves that typically carry higher frequency information.
Recent studies by Dorman et al. (in press) and Shannon et al. (submitted) lend support to the notion that such a shift in spectral envelope can be devastating for speech perceptual performance. Shannon and his colleagues implemented a simulation of a 4-channel cochlear implant, and used that to process signals for presentation to normal listeners. In their reference condition, channels were unshifted and spaced equally by purported distance along the basilar membrane. Performance was worse than that obtained with natural speech, but still relatively high (about 80% for words in sentences). However, when the spectral information was shifted so as to simulate an 8 mm shift on the basilar membrane basalward, performance dropped precipitously (<5% for words in sentences). Dorman et al. (in press) also found significant decrements in performance for basalward shifts of 4-5 mm. As they showed decreases in performance changing smoothly over this range of shifts, it is not surprising that the effects found were somewhat smaller than those reported by Shannon et al. (submitted)1. In both these studies, however, listeners were given little or no opportunity to adapt to such signals, so it is impossible to say of what importance such a mislocation of spectral shape is for cochlear implant users, who will be gaining experience with their implant typically for more than 10 hours per day.
In fact, there is much evidence to support the notion that listeners can learn to adapt to such changes, and even more extreme ones. Blesser (1972; 1969) instructed pairs of listeners to learn to communicate in whatever way they could over an audio communication channel that low-pass filtered speech at 3.2 kHz, and then inverted its spectrum around the frequency of 1.6 kHz. Although intelligibility over this channel was extremely low initially (in fact, virtually nil), listeners did learn to converse through it over a period of time.
There is evidence also from normal speech perception to suggest that an extraordinary degree of plasticity must be operating. In vowel perception, for example, it is clear that the spectral information that distinguishes vowel qualities can only be assessed in a relative manner, as different speakers use different absolute frequencies for the formants which determine spectral envelope structure. It might even be said that the most important characteristic of speech perception is its ability to extract invariant linguistic units from acoustic signals widely varying in rate, intensity, spectrum, etc.
In an initial attempt, then, to address this issue, we replicated the signal processing used by Shannon, et al. (submitted), and tested our subjects on a similar range of speech materials with both spectrally shifted and unshifted speech. What makes this study very different is that our subjects were given an explicit opportunity to learn about the shifted signals, both by repeating the speech tests over a period of time, but more importantly, by letting them experience the frequency-shifted signals as receivers in Connected Discourse Tracking (De Filippo and Scott, 1978). The advantages of Connected Discourse Tracking for this purpose are manifold, insofar as it is a quantifiable, highly interactive task using genuine connected speech, and thus has high face validity. Using it, we are not only able to give our subjects extensive experience with constant feedback, but also to monitor their progress.
2. Method
2.1 Subjects.
Four normally hearing adults, aged 18-22, participated in the
tests. Two were male and two were female. All were native speakers
of British English.
2.2 Test material.
Three tests of speech perception were used, all of which were
presented over Sennheiser HD475 headphones, without visual cues.
Two of these were computer-based segmental tests, with a closed
set of responses. The intervocalic consonant, or VCV test (vowel-consonant-vowel)
consisted of 18 consonants between the vowel  ,
hence
  , etc.,
uttered by a female speaker of Southern Standard British English
with stress on the second syllable. Each of the consonants
 occurred three times in a random order
in each test session. Listeners responded by using a mouse to
select one of the 18 possibilities, displayed on the computer
screen in alphabetical order in ordinary orthography (b ch d f
g k l m n p r s sh t v w y z). Results were analysed not only
in terms of overall percent correct, but also for percent correct
with respect to the features of voicing (voiced
/m n w r l y b d g z v/ vs. voiceless
 , manner of articulation (nasal
/m n / vs. glide /w r l y/ vs. plosive
/b p d t g k /vs. affricate
 vs. fricative
 and place of articulation (bilabial
/m w b p/ vs. labiodental /f v/ vs. alveolar /n l y d
t s z/ vs. palatal
 vs. velar /g k/). Note that studies like this often use an information
transfer measure to analyse performance by feature, rather than
percent correct. Although percent correct suffers from the drawback
that different levels of chance performance are not compensated
for in the calculation (e.g. that voicing judgments will
be approximately 50% correct by chance alone whereas place judgments
will be about 20% correct by chance), it is a more readily understood
metric whose statistical properties are better characterised.
The vowel test consisted of 17 different vowels or diphthongs in a /b/-/vowel/-/d/ context, in which all the utterances were real words or a common proper name - bad, bard, bared, bayed, bead, beard, bed. bid, bide, bird, bod, bode, booed, board, boughed, Boyd, or bud. The speaker was a (different) female speaker of Southern Standard British English. In each session, Each vowel occurred three times in a random order in a single session. Again, listeners responded with a mouse to the possibilities displayed on the computer screen.
The third test consisted of the BKB sentence lists (Bench and Bamford, 1979). These are a set of 21 lists, each consisting of 16 sentences containing 50 key words, which are the only words scored. The particular recording (described by Foster, et al. 1993) used the same female speaker who recorded the consonant test. Listeners wrote their responses down on a sheet of paper, and key words were scored using the so-called loose method (in which a response is scored as correct if the root of it matches the root of the presented word).
2.3 Signal processing.
All signal processing was done in real-time, with a user-friendly
programmable software system (Aladdin, from Nyvalla DSP
AB) based on a digital-signal-processing PC card (Loughborough
Sound Images TMS320C31) running at a sampling rate of 22.05 kHz.
The technique was essentially that described by Shannon, et
al. (1995) as shown in the block diagram in Figure 1. The
input speech was low-pass filtered, sampled, and pre-emphasised
(1st-order with a cut-off of 1 kHz). The signal was
then passed through a bank of four analysis filters (6th-order
elliptical IIR) with frequency responses that crossed 15 dB down
from the pass-band peak. Envelope detection occurred at the output
of each analysis filter by half-wave rectification and 1st-order
low-pass filtering at 160 Hz. These envelopes were then multiplied
by a white noise, and each filtered by a 6th-order
elliptical IIR output filter, before being summed together for
final digital-to-analogue conversion. The gain of the four channels
was adjusted so that a flat-spectrum input signal resulted in
an output spectrum with each noise band having the same level
(measured at the centre frequency of each output filter).
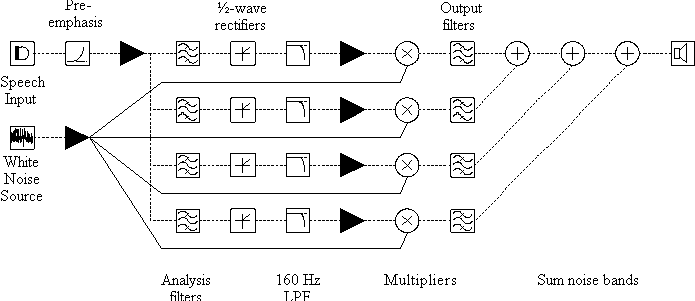
Figure 1. Block diagram of the processing used for transforming the speech signal. Note that the filled right-pointing triangles represent places where a gain adjustment can be made, but these were all fixed prior to the experiment.
Cross-over frequencies for both the analysis and output filters were calculated using an equation (and its inverse) relating position on the basilar membrane to its best frequency (Greenwood, 1990):
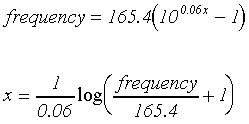
where x is position on the basilar membrane (in mm) from the apex, and frequency is given in Hz.
The normal condition, in which analysis and output filters
had the same centre frequencies, was obtained by dividing the
frequency range from 50-4000 Hz equally using the equations above.
This is similar to the LOG condition used by Shannon et al.
(submitted). In the shifted condition, output filters
had their band edges increased upward in frequency by an amount
equal to 6.46 mm on the basilar membrane (e.g., shifting
4 kHz to 10 kHz). The inverse condition used the same filters
as normal, but the output filters were ordered in decreasing
frequency, resulting in a inversion of the spectrum.
| 50 | 286 | 782 | 1821 | 4000 | |
| 360 | 937 | 2147 | 4684 | 10000 |
Table I. Frequencies of the band edges used for the four output filters in the two main conditions of the experiment, specified in Hz. The analysis filters always used the normal frequencies.
2.4 Procedure.
In the first testing session, listeners were administered the
three speech tests in each of three signal processing conditions:
1) normal speech (primarily to familiarise listeners with the
test procedures, and not used with the BKB sentences); 2) unshifted
4-channel; 3) frequency-shifted 4-channel. One session of each
of the vowel and consonant tests was performed with normal speech,
and two of all three tests for the two 4-channel conditions.
Each subsequent testing session began with four 5-min blocks of audio-visual connected discourse tracking (CDT - De Filippo and Scott, 1978) with a short break between blocks. The talker in CDT was always the same (the third author). Talker and receiver faced each other through a double-pane glass partition in two adjacent sound-proofed rooms. The receiver wore Sennheiser HD475 headphones through which the audio signal was presented. Near the receiver was a stand-mounted microphone to transmit the receiver's comments undistorted to the talker. All CDT was done with the audio channel to the receiver undergoing the frequency-shifted 4-channel processing. A low-level masking noise was introduced into the receiver's room so as to ensure the inaudibility of any of the talker's speech not sufficiently attenuated by the intervening wall. Talker and receiver worked together to maximise the rate at which verbatim repetition by the receiver could be maintained. The initial stages of CDT were performed audio-visually because it seemed highly unlikely that any subject would be able to track connected speech at all on the basis of the shifted sound alone, at least initially.
In the 6th-10 th testing session, the first 5-min block of CDT was completed normally, i.e. audio-visually. Then visual cues were removed by covering the glass partition, and the second block of CDT was attempted in an audio alone condition. If the receiver scored more than 10 words per minute (wpm), the remaining two blocks of CDT were conducted in the audio alone condition. If, however, the receiver scored less than 10 wpm, visual cues were restored for the remaining two 5-min blocks of CDT.
After each CDT training session, subjects were required to repeat the three speech perception tests given on the initial session (again for two runs of each test), but only in the shifted condition. After ten sessions of training (each consisting of four 5-min blocks of CDT) and testing, a final set of tests in the unshifted condition was also performed.
For one subject, training and testing then continued in the inverse condition. Two runs of each of the three speech tests were performed without any training. For the following three sessions, subject SM underwent training using audio-visual CDT (4 5-min sessions) followed, as in the main phase of the experiment, by two runs of each of the three speech tests.
2.5 Analysis
All results are presented as means across subjects. Unless otherwise
stated, all statistical claims are based on a 0.05 significance
level. As we are particularly interested in trends across sessions,
three different ways were used to assess the extent to which increases
in performance were significant, and the extent to which they
appeared to be slowing over sessions. First, an ANOVA was used
to look for significant linear and quadratic trends across session.
A significant positive linear trend (no negative linear trend
was ever found) indicates performance is improving, while an additional
quadratic trend indicates a deceleration in the increases of performance.
Secondly, a regression analysis compared whether the outcome measure
correlated better with the logarithm of the session number (indicating
smaller increases in performance with increasing session number),
or session number itself (indicating linear increments in performance
across session). Finally, the regression analysis was extended
to determine the extent to which the square of the single explanatory
variable (either session number or its logarithm) could make an
additional significant contribution to the regression equation.
If the squared term was significant when using session number,
but not when using the log of the session number, this would be
strong evidence that there were increases in performance, but
that the rate of increase was slowing down.
3. Results
3.1 Initial test session.
As expected, performance was high when the subjects were presented
with natural speech. The mean score was 98.6% correct (range:
96.3-100.0) for the VCVs, and a little lower for the vowels (mean
of 91.6% and a range of 86.0-96.1).
In the unshifted condition, performance was worse than with natural speech (as would be expected from Shannon et al., 1995), but still quite high, as seen in Table II. The shift in spectrum, however, had a devastating effect on speech scores, especially for those tests that require the perception of spectral cues for good performance.
For the understanding of BKB sentences, performance dropped from 64% of key words correct to just under 1%. Vowel perception, too, was severely affected. Performance on VCVs was least affected, primarily because manner and voicing were relatively well received. These features are known to be well signalled by temporal cues (Rosen, 1992), cues which are not affected by the spectral shift. The perception of place of articulation, depending as it does upon spectral cues, was the most affected of the phonetic features.
Table II. Scores obtained in the recorded speech tests for the unshifted (un) and shifted (shft) conditions in the first testing session. The scores for the first six columns are simply expressed as percent correct, while the scores for voicing, place and manner are of the percent correct for each feature. Scores for each subject represent a mean of two tests.
3.2 Connected Discourse Tracking (CDT).
Although the main purpose of CDT was to provide a highly interactive
training method, it is interesting to examine the trends found
(Figure 2). Only one subject (CP) failed to meet the criterion
of 10 wpm in the auditory alone condition for sessions 6-10, and
even he met it on two of the sessions.
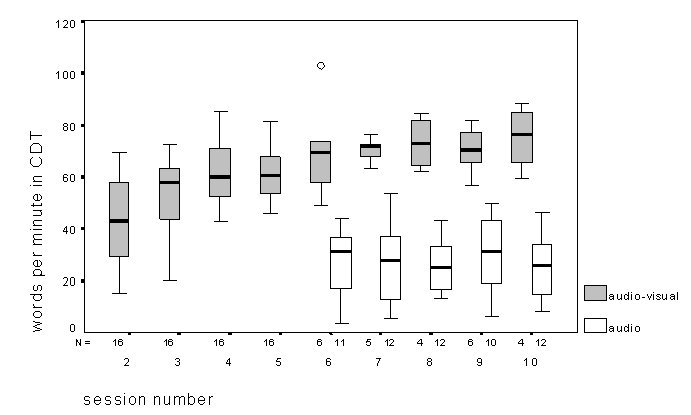
Figure 2. Box plots (across subjects) of obtained rates in Connected Discourse Tracking (CDT). The box indicates the inter-quartile range of values obtained, with the median indicated by the solid horizontal line. The range of measurements is shown by the whiskers except for points more than 1.5 (indicated by 'o') or 3 box lengths ('*') from the upper or lower edge of the box. Although no '*' appears on this plot, box plots are also used for Figs. 3-8, where these symbols do sometimes occur.
As would be expected, performance audio-visually is always considerably better than that obtained by auditory means alone. There also appears to be a clear improvement in the audio-visual condition, especially in the initial sessions. This was confirmed by a significant linear and quadratic (but not cubic) trend in performance across sessions in an ANOVA, but with no trend in the auditory alone condition. A separate regression analysis showed wpm to be better correlated with the logarithm of session number, than with session number itself. Similarly, a regression analysis using session number and its square showed a significant quadratic term, while one using the log of the session number did not. In short, it is clear that performance improvements are diminishing across sessions in the audio-visual condition. Note too that audio-visual rates become quite high in the later sessions (maximum rates of CDT under ideal conditions are about of 110 wpm, De Filippo and Scott, 1978), and this also may be limiting the rate of increase that is possible.
3.3 Sentences (BKB).
Figure 3 shows the results obtained in the BKB sentence
test. As noted above, performance is far superior for unshifted
speech in session 1. However, performance improves significantly
across sessions in the shifted condition, even if not reaching
the level obtained for unshifted speech (which itself shows
little improvement). All these assertions are supported by a simple
one-way ANOVA looking only at the results obtained at sessions
1 and 10 with a Tukey HSD test based on 4 groups (2 sessions x
2 conditions).
Trends across sessions are very similar to those found for audio-visual CDT. The same set of ANOVA and regression analyses again showed performance to be increasing over sessions, with the greatest increases in the early sessions.
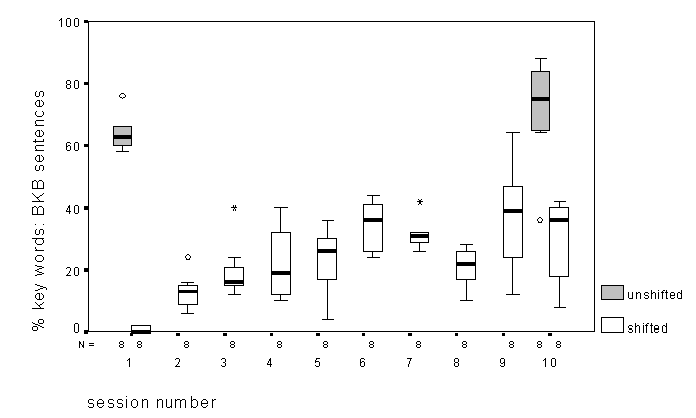
Figure 3. Box plots of performance with BKB sentences, as a function of session and condition, across subjects.
3.4 Vowels
Results for the vowel test are displayed in Figure 4. Looking
first only at results obtained in sessions 1 and 10, the pattern
is as found for BKB sentences (supported by the same Tukey HSD
test). Performance is always worse in the shifted condition,
even though it improves significantly over the course of training.
The increase in performance in the unshifted condition
is not significant.
Trends across sessions were somewhat different than those found
for sentences. Here, there was only evidence for a linear improvement
in performance, both in a one-way ANOVA and regression analysis.
Also, taking the logarithm of the session number did not improve
the correlation over that obtained with the session number itself.
It therefore appears that performance is increasing linearly over
session number, with no evidence of a deceleration.
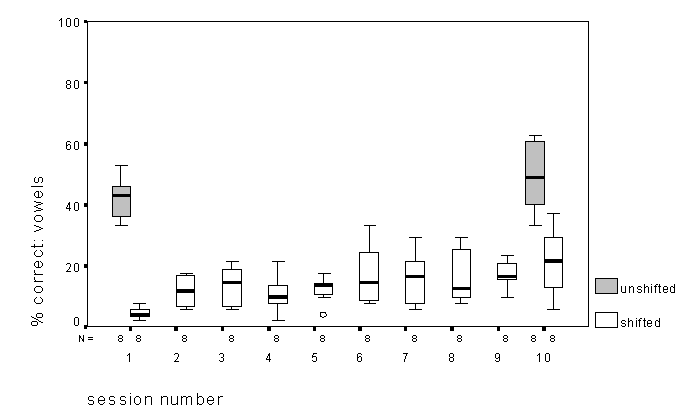
Figure 4. Box plots of performance on the vowel test, as a function of session and condition, across subjects.
3.5 Intervocalic Consonants (VCVs).
Figure 5 shows, across listeners, performance on the VCV
test. A one-way ANOVA on the shifted results show a significant
effect of session, with significant linear and quadratic trends.
This appears to result from the effect that there is large increase
in performance from the first session to the second, with smaller
increases thereafter. As for the trends found with sentences,
the logarithm of the session number correlated more highly with
percent correct than the session number itself. Also, a regression
analysis using session number showed a significant quadratic term,
while one using the log of the session number did not.
A simple 2x2 factorial ANOVA investigating the effect of session and shift for sessions 1 and 10 only, shows a significant interaction. A Tukey HSD test on the 4 categories in a one-way ANOVA shows that this results simply from performance in the shifted condition in the first session being significantly poorer than at the last, and poorer than unshifted performance always. The other three mentioned sessions are not statistically different from one another. This outcome is quite different to those from the other speech tests, in which performance in the shifted condition never reached that attained in the unshifted condition.
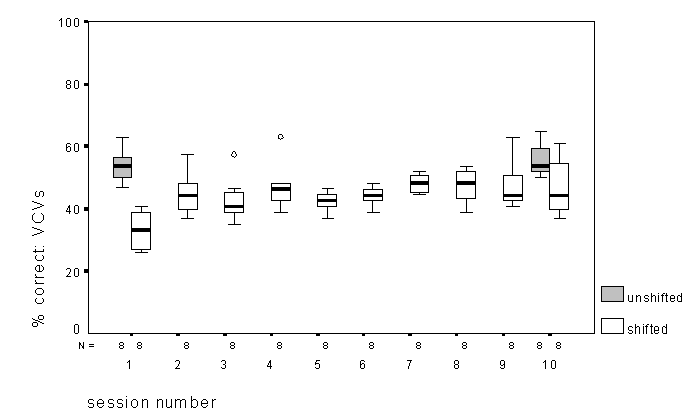
Figure 5. Box plots of percent correct in the VCV test as a function of session number for both shifted and unshifted conditions, across subjects.
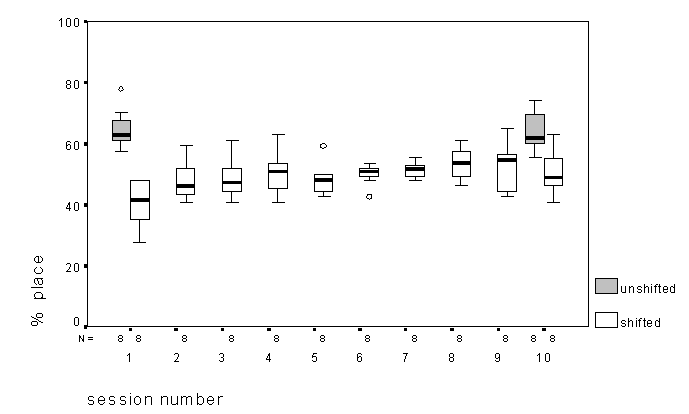
Figure 6. Percent correct for place of articulation in the VCV test as a function of session number for both shifted and unshifted conditions.
A slightly different outcome arises for the perception of place of articulation (Figure 6). As for percent correct, performance in the unshifted condition did not change across sessions, and shifted performance in session 1 was poorer than in the other three conditions. Here, however, shifted performance at session 10 still did not reach the level of the unshifted condition, even though it was significantly better than at session 1. But, just as with percent correct, a one-way ANOVA on the shifted results shows significant linear and quadratic terms (although the latter is barely significant at p=0.04), reflecting a greater improvement in performance in earlier sessions (also reflected in a regression analysis with the logarithm of the session number).
Changes in the accuracy of voicing and manner perception were smaller through training, as would be expected from the greater role temporal aspects play in signalling these features and the higher initial performance levels (Figure 7 and Figure 8). Results for voicing were similar to those found for percent correct, in that performance in the unshifted condition did not change across training, but was significantly worse in the shifted condition only in session 1. For manner, the only significant difference was between the shifted conditions across the first and last session, performance having significantly improved across sessions. Both voicing and manner perception showed significant linear components in a one-way ANOVA as a function of session (but no quadratic term), indicating a significant linear improvement over time (albeit small).
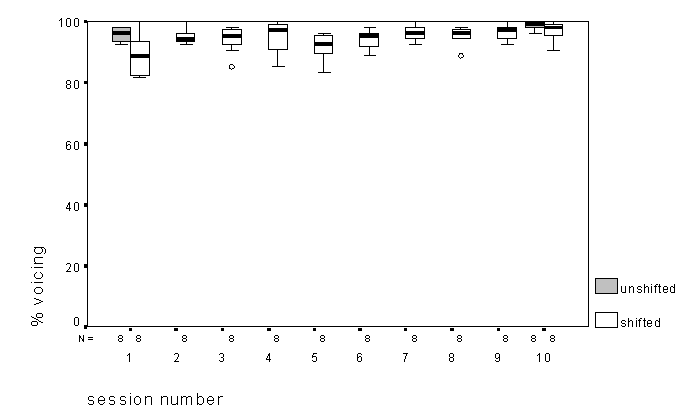
Figure 7. Percent correct for voicing in the VCV test as a function of session number for both shifted and unshifted conditions.
In short, performance in the VCV task for shifted speech
improved over the course of training, with overall accuracy, and
that for manner and voicing, statistically indistinguishable from
the unshifted condition. However, the results from the
perception of place of articulation, expected to be most affected
by frequency shifts, suggests that subjects had not quite reached
the level of performance they were able to obtain with unshifted
speech.
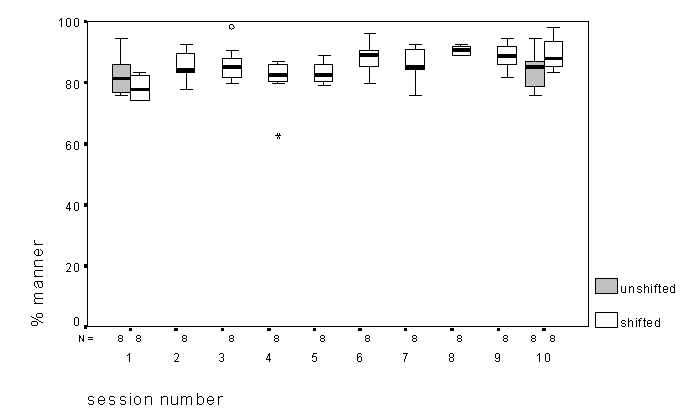
Figure 8. Percent correct for manner of articulation in the VCV test as a function of session number for both shifted and unshifted conditions.
3.6 Inverted speech
An extensive analysis of the data available for the inverted
condition would clearly not be justified, given its relative paucity.
Still, it is interesting at least to note the gross features of
the results obtained. First, Table III shows, from summary statistics,
that the inverted condition is considerably more difficult
even than the shifted condition, in all except the vowel
test. Second, the time course of learning appears to be much slower
than that obtained for the shifted speech. None of the
three speech tests showed any statistical trends across the 4
tested sessions in terms of percentage correct, even though the
shifted condition often led to the biggest improvements
in these early sessions. On the other hand, there is strong evidence
of some learning going on, at least in some tests. In particular,
a 2-way ANOVA of the CDT results summarised in Table III, using
the factors session and condition, show no interaction term, and
strong main effects of both factors (p<0.003). In words,
performance is significantly better for shifted than for
inverted speech, but performance in both conditions increases
over sessions. Also, for the perception of place of articulation
only (the feature most dependent on the perception of spectral
structure), there is a significant correlation of percent correct
with session number for the inverted condition (although
this does not show up in the overall scores). This also confirms
the idea that there is learning in the inverted condition,
but at a considerably slower rate than for speech simply shifted.
It is also interesting to note the reduced performance in the inverted condition on the VCV test even for features that are known to be well signalled by temporal cues, for example voicing. These would not be altered much by the frequency inversion. It may be that subjects are, in fact, using gross spectral cues instead of the temporal ones (voiced sounds have a spectrum much more weighted to the low frequencies than voiceless ones). Such an explanation would account for the fact that shifting the speech doesn't alter the perception of voicing (as the gross spectral cue remains) but inverting it does (where voiceless sounds would now have more low-frequency energy). Alternatively (or at the same time), it may be that subjects find it difficult to use the temporal cues when they are presented in frequency regions far removed from their normal "place" (Grant et al., 1991).
| unshifted | |||||||
| shifted | |||||||
| inverted |
Table III. Mean performance in three conditions for subject SM. CDT was performed audio-visually, is measured in wpm, and represents the mean of the first three sessions (each consisting of four 5-min periods) in each of the shifted and inverted conditions (no CDT was done in the unshifted condition). For the rest of the columns, the means are obtained from all tests performed in the unshifted condition (4 tests), and from the first 8 tests performed in each of the shifted and inverted conditions (representing all tests in the last-mentioned condition). Scores represent the mean percentage correct for BKB, bVd and VCV tests, whereas place, manner and voicing refer to the mean percentage correct with regard to each of these features for VCVs.
4. Summary and discussion
Two aspects of the current study seem especially striking. First,
there is the enormous decrement in performance in understanding
speech when it is processed to contain only envelope information
in 4 spectral channels that are shifted in frequency (a fact already
known from the earlier study of Shannon et al., submitted, of
course). Given the extreme flexibility of the speech-perceptual
system, it would certainly have been easy to imagine otherwise.
That different tests suffer different degrees of degradation is
easily understood, as it would be expected that speech materials
that require effective transmission of spectral information for
good performance (e.g., vowels and sentences) would be
more affected by a spectral shift than those in which much can
be apprehended through temporal cues or gross spectral contrasts
(e.g., consonants).
Second, there is the incredible speed at which listeners learn to compensate for the spectral shift. After just 3 hours of experience (not counting the tests themselves, which actually present quite short periods of speech), performance in the most severely affected tasks (vowels and sentences) increases from near zero levels, to about one-half the performance in the unshifted condition. We cannot, of course, determine whether compensation would be complete after some further degree of training, nor even how long it would take were it to be possible. Nor do we even know the extent to which CDT is effective as a training procedure, whether other procedures would be better, nor indeed whether the progress the subjects made can be attributed primarily to the use of CDT (although a relatively straightforward experiment could tell us that). These, though, are secondary questions. What is clear is that subjects were able to improve their performance considerably over short periods of time, periods that are inconsequential from the point of view of an implant patient.
There are other, perhaps more theoretical questions, that would merit attention. One concerns the nature of the processing used by Shannon et al. (1995). Although discussion of this technique has focused purely on the effects of alteration of the frequency spectrum of the sound, it is also apparent that temporal aspects are also severely affected. It seems likely that at least part of the degradation in performance with use of the simulation algorithm arises simply from the degradation of contrasts in periodicity vs. aperiodicity, and in the perception of intonation, and not wholly from changes in spectral structure. It is an open question the extent to which this simulates the situation for implant users, but there is at least a possibility that implant users have better temporal processing than normal listeners under such simulation.2
To summarise, spectral distortions of the kind that are likely to be present in multi-channel cochlear implants can pose significant limitations on the performance of the listener, at least initially. With practise, a large part of these decrements can be erased. Although we cannot say on the basis of this study whether place/frequency mismatches can ever be completely adapted to, it is clear that short-term experiments seriously exaggerate the long-term consequences of such spectral shifts. If we were to argue, as do Shannon et al. (submitted) that matching frequency and place are essential, we would have to argue that listeners with shallow electrode penetrations should not receive speech information below, say, 1-2 kHz. That such an approach would be preferable to one in which the lowest frequency band of speech is assigned to the most apical electrode seems highly unlikely to us. For one thing, it is clear that the lower frequency regions of speech are the best for transmitting the temporal information that can most suitably complement the information available through lipreading. Could we possibly imagine that the shallower an electrode array is implanted, the higher should be the band of frequencies we present to the patient? It may well be that patients with shallower electrode penetrations will perform more poorly on average than those with deeper penetrations. But this probably results more from the loss of access to the better-surviving apical neural population (Johnsson, 1985), or from the fact that the speech frequency range must be delivered to a shorter section of the nerve fibre array, than from the place/frequency mismatch per se. It seems entirely possible that the speech perceptual difficulties which implant users experience as a result of a place/frequency mismatch may be a short-term limitation readily overcome with experience.
Acknowledgements
This work was supported by Defeating Deafness (The Hearing Research
Trust), The Wellcome Trust (Grant No. 046823/z/96) and a Wellcome
Trust Vacation Scholarship to LCW (Grant reference number VS/97/UCL/016).
References
Bench, J., and Bamford, J. (Eds.). (1979). Speech-hearing Tests and the Spoken Language of Hearing-impaired Children. London: Academic Press.
Blesser, B. (1972). "Speech perception under conditions of spectral transformation: I. Phonetic characteristics," Journal of Speech and Hearing Research 15,5-41.
Blesser, B. A. (1969). Perception of spectrally rotated speech. Unpublished Ph.D., MIT, Cambridge, MA.
De Filippo, C. L., and Scott, B. L. (1978). "A method for training and evaluating the reception of ongoing speech," Journal of the Acoustical Society of America 63,1186-1192.
Dorman, M. F., Loizou, P. C., and Rainey, D. (in press). "Simulating the effect of cochlear-implant electrode insertion depth on speech understanding," Journal of the Acoustical Society of America .
Foster, J. R., Summerfield, A. Q., Marshall, D. H., Palmer, L., Ball, V., and Rosen, S. (1993). "Lip-reading the BKB sentence lists: corrections for list and practice effects," British Journal of Audiology 27,233-246.
Grant, K. W., Braida, L. D., and Renn, R. J. (1991). "Single band envelope cues as an aid to speechreading," The Quarterly Journal of Experimental Psychology 43A,621-645.
Greenwood, D. D. (1990). "A cochlear frequency-position function for several species - 29 years later," Journal of the Acoustical Society of America 87,2592-2605.
Johnsson, L.-G. (1985). "Cochlear anatomy and histopathology," in Cochlear Implants, edited by R. F. Gray (Croom Helm, London).Rosen, S. (1992). "Temporal information in speech: acoustic, auditory and linguistic aspects," Philosophical Transactions of the Royal Society London B 336,367-373.
Shannon, R. V., Zeng, F.-G., Kamath, V., Wygonski, J., and Ekelid, M. (1995). "Speech recognition with primarily temporal cues," Science 270,303-304.
Shannon, R. V., Zeng, F.-G., Wygonski, J., and Kamath, V. (submitted). "Speech recognition with altered spectral distribution of envelope cues," Journal of the Acoustical Society of America .
© Stuart Rosen, Andrew Faulkner and Lucy Wilkinson.
