3. Audio signals and systems
Key Concepts
- All signals may be decomposed into a combination of sinewaves
- We can describe signals in terms of their spectrum
- We can describe systems in terms of their frequency response
- We can show how the spectrum of a signal changes with time using a spectrogram
- We can make high-quality audio recordings of speech by following good practice
Learning Objectives
At the end of this topic the student should be able to:
- describe the system components involved in audio recording and reproduction
- explain how complex sounds are comprised of many sound elements of different frequencies
- use the concept of frequency response to explain the operation of a band-pass filter
- describe how a band-pass filter can be used to analyse a complex sound
- explain in what way the sound spectrum is a fingerprint of a sound
- make a good quality audio recording of speech
Topics
- Audio Components
- Microphones. Convert sound pressure variations into changes in electrical voltage. Dynamic microphones are based on movement of a coil within a magnetic field which generates a small current. Condensor microphones are based on movements of a diaphragm which affects the capacitance of a circuit.
- Amplifiers. Proportionally increase the size of voltage variation in a circuit. Amplification is often expressed in decibels (dB). 1dB = a change by a factor of ×1.12, 20dB = a change by a factor ×10.
- Loudspeakers. Convert electrical voltage variations into movements of a diaphragm which in turn cause sound pressure variations in the air.
- Recorders. Audio recorders make a permanent record of audio signals. In analogue recorders, the variation is captured in terms of the physical properties of some medium (such as the magnetic properties of crystals on a tape). In digital recorders, the variation is captured in terms of the amplitude of successive sample instants of the signal; these amplitudes are then stored as discrete numerical values.
- Filters. Filters change the quality (timbre) of a sound. For example a bass control on an amplifier preferentially boosts the lower frequency components in the signal.
- Types of sound
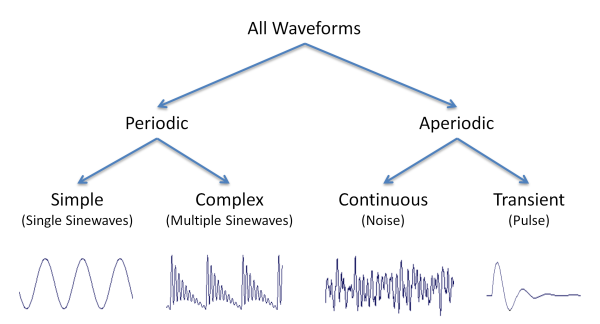
Sounds are pressure fluctuations caused by vibrating objects. The sound pressure waveform graphically represents the changes in pressure with time. If the source vibrations are cyclic (perfectly repetitive) then the waveform will show a periodic shape. We say the sound is periodic. If the source vibrations are random or chaotic then the waveform will not be periodic. We say the sound is aperiodic.
We can differentiate between two types of periodic sounds: those that arise from the simplest possible vibrating sources, and those that arise from complex vibrating sources. The simplest possible vibrations are called simple harmonic motion, and arise in systems such as a pendulum, a mass on a spring or a tuning fork. The vibrations of such systems have a sinusoidal shape, and the consequent waveforms are called sinewaves.
Everyday, complex objects do not vibrate in simple harmonic motion. When they vibrate the waveform shape of the sound generated is not sinusoidal. However, it can be shown that any periodic vibration can be analysed into a combination of simple, sinusoidal vibrations; or in other words, any periodic waveform can be constructed by adding sinewaves together. Non-sinusoidal periodic waveforms are called complex periodic.
Objects may vibrate non-cyclically for two different reasons: either because their behaviour is random and unpredictable (such as an object being buffeted by the wind), or because the vibration only occurs once (such as two objects colliding). We can thus make a distinction between a continuous aperiodic waveform, and a transient aperiodic waveform. Continuous aperiodic sounds are sometimes called noise, but don't confuse this technical term for the everyday meaning of 'noise'.
This diagram summarises the different waveform classes:
- Frequency Response
Audio components like microphones, amplifiers and loudspeakers are systems that process sound waveforms. They take in a waveform on their input and produce a waveform on their output. An amplifier would likely increase the amplitude of the waveform, but perhaps make little other change to the waveform shape. However, in general, systems make changes to the waveforms passing through them (consider for example a bass boost control - this will preferentially increase the amplitude of the low frequency components in the waveform).
We characterise the effect of a system on the waveforms passing through them by calculating the system's frequency response. The basis for the idea is this: all waveforms are made up from one or more sinusoidal waveforms added together. If we know what the system does to every sinewave separately, then we can predict what the system would do to each sinewave in a complex waveform and hence what the resultant effect on the whole waveform would be.
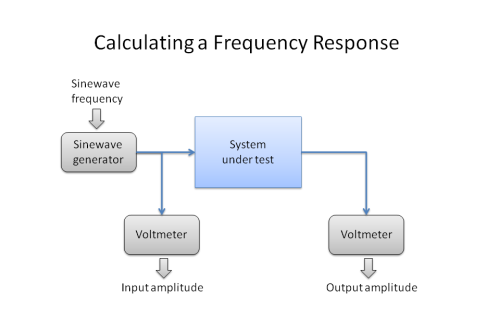
To measure the frequency response of a system, we pass individual sinusoidal signals (sinewaves) through the system and measure the relative size of the output signal to the input signal as a function of the frequency of the sinewave. We then plot a graph of how the ratio of output amplitude to input amplitude varies with the sinewave frequency.
This diagram shows how we would measure a frequency response in the laboratory:
This diagram shows what a frequency response graph might look like - here for a simple resonator:
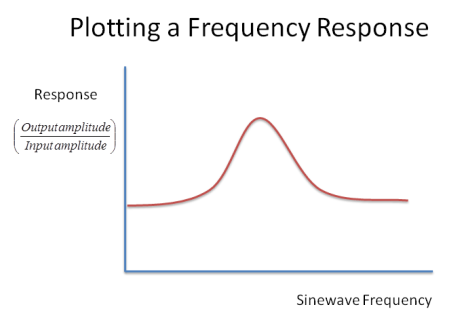
You can see that this system prefers to pass some frequencies more than others - this is the definition of a resonator.
- Band-pass Filters
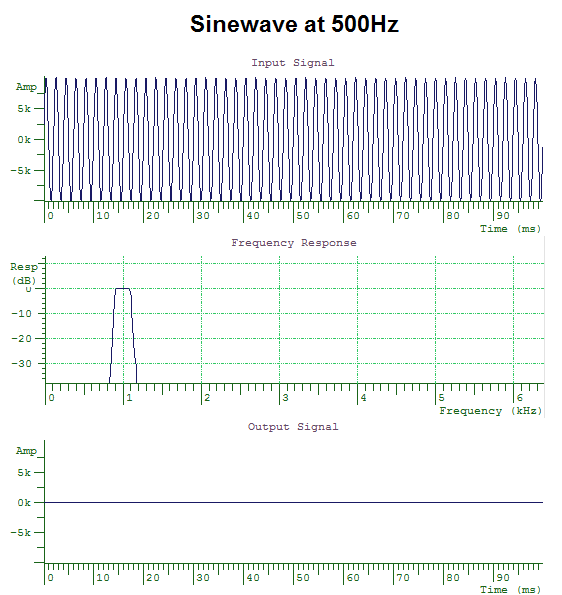
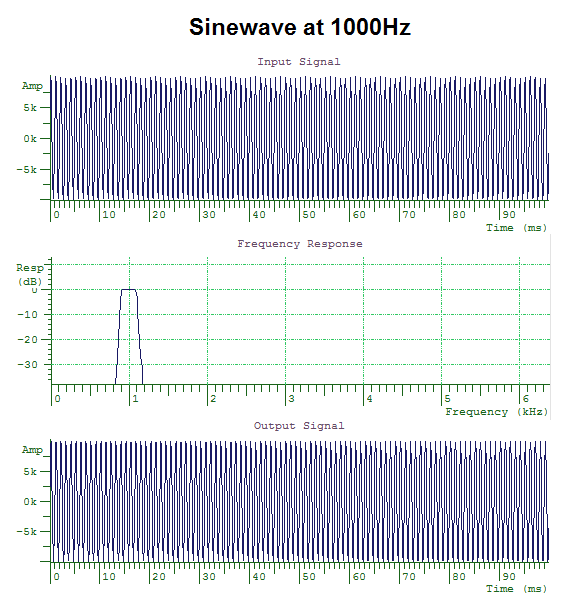
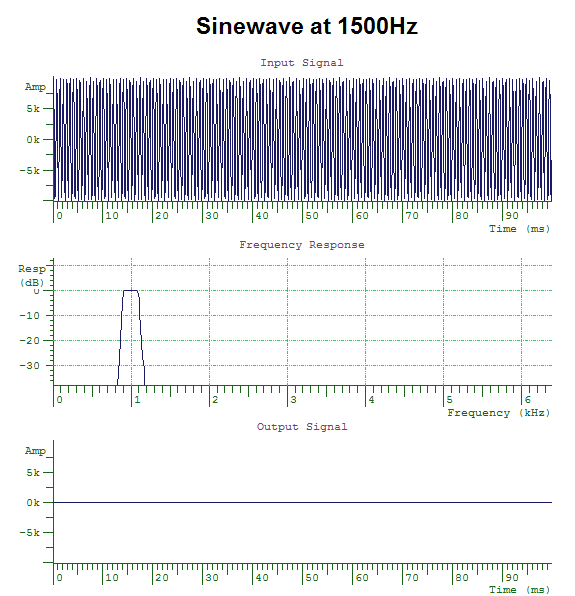
Audio systems can be constructed that preferentially pass a restricted range of frequency components in a signal. These are called band-pass filters. For example, a band-pass filter between 900 and 1100Hz will only pass through those frequency components of a signal that fall between 900 and 1100Hz. A simple resonator is an example of a primitive band-pass filter.
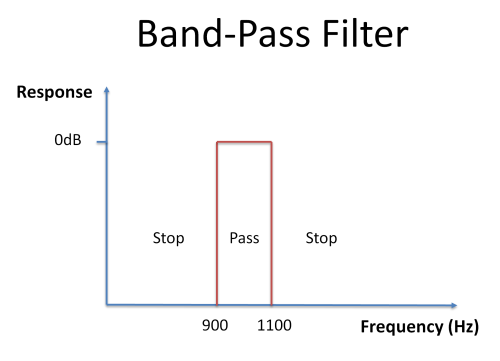
When we pass sinewaves of different frequency through this band-pass filter, only frequencies that fall within the pass band are passed through the filter; frequencies that fall into the stop bands are attenuated. This behaviour can be seen in the diagrams below. The filter only allows through sinewaves with frequencies between 900 and 1000Hz.
- Amplitude Spectrum
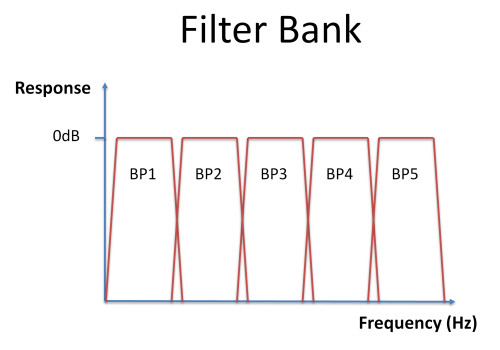
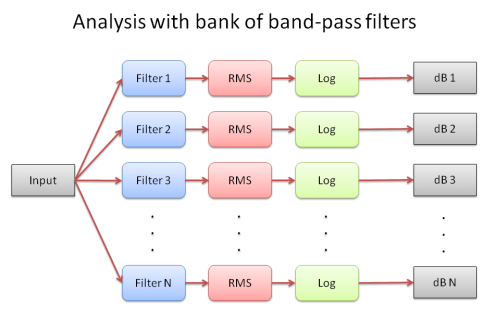
We can use a set of band-pass filters to explore what frequency components are present in a signal. We create a number of band-pass filters with non-overlapping pass-bands which cover some frequency range of interest; this is known as a filter bank:
By looking at how much of the signal passes through each band-pass filter in the filter bank, we can calculate how much energy is present in the signal in each band. We measure the energy in the signal by looking at the average signal amplitude (RMS=root-mean-square) at the output of each filter and convert to decibels by taking the logarithm:
The graph of signal energy against band frequency is called the spectrum of the sound.
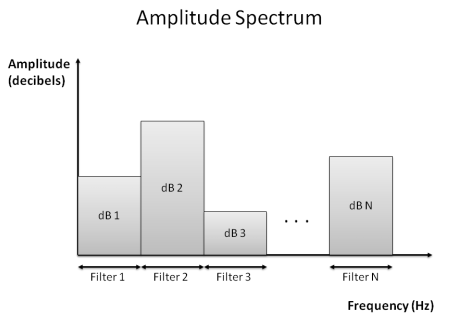
The spectrum of a sound is a kind of fingerprint of the sound in terms of the amplitudes of vibrations found over a range of frequencies. Bass sounds (dark sounds) have predominantly more amplitude at low frequencies, while treble sounds (bright sounds) have predominantly more amplitude at high frequencies. The spectrum provides a convenient way to describe the important properties of the sound particularly with respect to perceived timbre.
- Spectrography
While a spectrum gives us an analysis of a sound at one particular time, a spectrogram shows us how the spectrum of a sound changes with time. That is, it gives a time dimension to the spectrum.
A spectrogram is a three-dimensional analysis of the sound: it shows how the amplitudes of the elementary sound components present in a sound change with time. Thus it has axes of amplitude, frequency and time. Since we can only plot two-dimensions on paper, the amplitude axis is displayed on a coloured scale, typically a grey-level scale in which white is chosen to represent low amplitude and black to represent high amplitude.
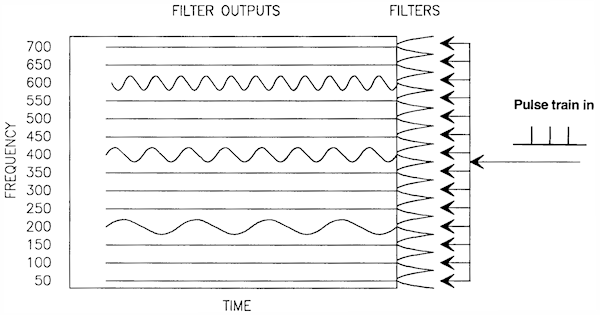
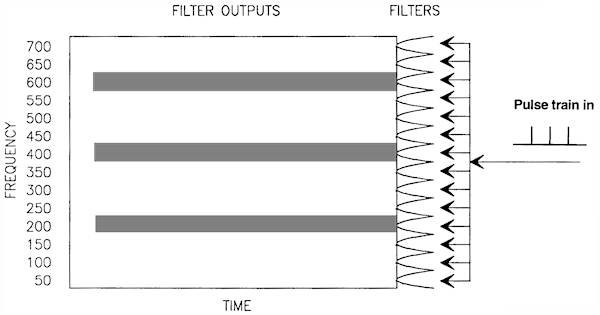
To understand how a spectrogram is made, consider a bank of band-pass filters which are each fed simultaneously with our input signal. The filtered output waveforms will show how much energy there is in the signal in the frequency region represented by each filter. But instead of just calculating an RMS value (as we did to get the spectrum), we now monitor the average amplitude of the filter outputs and plot these as a grey level over time. Here are the filtered outputs:
and here are the filtered outputs as levels of grey:
- Good practice in speech recording
- Choose a quiet place
- Choose a non-reverberant place
- Choose an appropriate recorder
- Choose an appropriate microphone
- Place the microphone close to the speaker but out of the air stream
- Set and monitor the recording levels
- Keep records
Readings
Essential
- Wikipedia article on Sound recording and reproduction.
Background
- S. Rosen & P. Howell, Signals and Systems for Speech and Hearing, second edition, Emerald Press, 2010. [in library] This is a very accessible text book on audio signals and systems for those interested in taking the subject further.
- ESystem - tool for for Learning Signals and Systems Theory. This is a program that runs on a Windows PC for learning about signals and systems. There is also a web version that will run on some web browsers.
Laboratory Activities
In this week's lab session you will practise making a good quality audio recording of speech.
Reflections
You can improve your learning by reflecting on your understanding. Come to the tutorial prepared to discuss the items below.
- Why does a sound get quieter the further you are away from the source?
- How could you change the pitch of a recorded sound?
- If recording levels are set too low, an audio recording becomes noisy. Why?
- If recording levels are set too high, an audio recording becomes distorted. Why?
- How might you measure the frequency response of a loudspeaker?
- How does a hearing aid work? Why might a hearing aid "whistle"?
- The frequency response of the outer and middle ears shows a preference for frequencies between 1000-4000Hz. What does this mean for how we hear sounds?
- If the ear is a filterbank, where are the filters?
Word count: . Last modified: 10:25 23-Jan-2018.