9. Variation With Style & Emotion
Learning Objectives
- to appreciate the range of acoustic properties of speech that vary across speaking styles and emotions (for a given speaker, for the same linguistic message)
- to understand some of the challenges in describing speaking styles or quantifying emotion
- to appreciate some of the methodological problems associated with studying the phonetics of speaking style or emotion
- to appreciate some of the ethical problems associated with studying the effect of emotion on speech, or the effect of physiological state on speech
- to take part in a subjective rating task and perform analysis on the results
Topics
- Why study intra-speaker variation?
The same speaker can produce the same utterance in different ways depending on the communicative situation, the emotional state of the speaker, or the physiological state of the speaker. We call this intra-speaker variability to distinguish it from variability across speakers for the same message, or variability within a speaker for different messages. Intra-speaker variability has been studied much less than other types of variability, perhaps because of theoretical, methodological and ethical problems, as we shall see. The goal of intra-speaker variability research is to account for that variability in speech which is systematically related to speaking style, emotion or physiological state. If such associations could be found, then it could lead to applications which assess the emotional or physiological state of speakers on the basis of their speech; this might be used to track their health and mental state, or to provide them with a better service (in a call-centre for example), or to adapt how they might be treated by a computer system (in an automated telephone enquiry system, say). Better models of intra-speaker variability may make speech and speaker recognition systems more robust. Research in speaking styles might lead to synthetic speech which is better adapted to the communicative context. It is also interesting to relate the effect of emotional state on human speech to the effect of emotional states on vocalisations of non-human primates or other animals. There is longstanding interest in the problem of the objective detection of deception in speech.
- Speaking Style Variation
Defining style
While there is general agreement that speakers change their “style” of speaking according to the communicative situation (e.g. chatting to a friend, reading a children’s story, giving an acceptance speech, ...), there is no general agreement for how to describe the situation such that it directly relates to measurable changes in speech. Are communicative situations and styles discrete things that do not stand in any quantitative relation to one another, or can all styles be arrayed along a small number of dimensions of variation? Eskenazi (1993) proposes that all styles can be positioned in a three dimensional space of intelligibility, familiarity and formality:
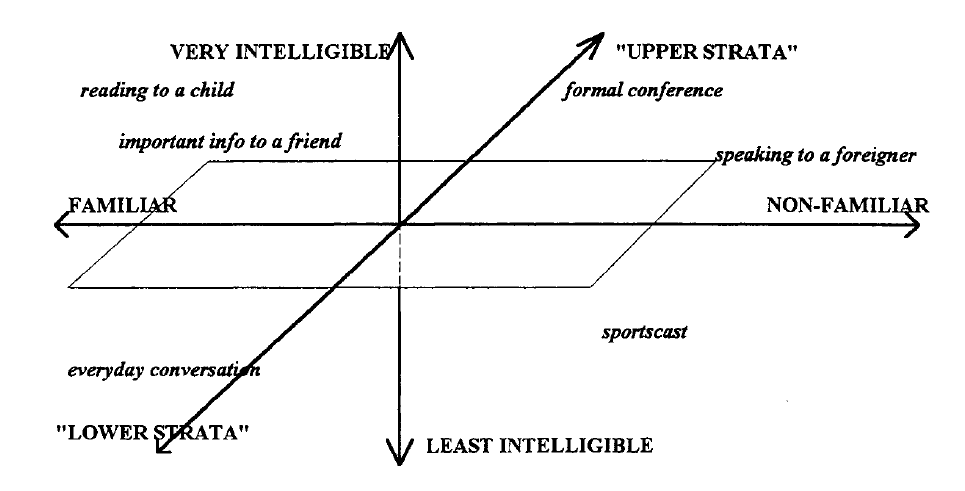
The choice affects the research methodology: do we treat styles as discrete factors to be studied with analysis of variance or as continuous influences to be studied using regression?
Experimental Methods
We can use our instrumental methods to compare the same utterance spoken in different styles if we know that the only difference is one of style. We might record a person chatting to a friend then later ask them to read the same utterances in a formal way, but the second recording is not only prepared speech it is “old” speech, speech that is now divorced from its intentions.
Data collection itself can be a challenge: the fact that we seek to record speech in very controlled environments means that listeners know they are being recorded which may in itself change how they speak. Recent work in this area has used partially-controlled tasks where a dialogue is recorded from two participants engaged in an artificial task, such as map-reading or picture-comparison. By controlling the familiarity of the speakers, the language background of the speakers, the hearing impairment of the speakers, or the quality of the audio channel, the experimenter can force different communication requirements on the speakers and see how that affects their speech for a number of known (task-related) words.
In terms of acoustic properties, prosodic information such as speaking rate, pauses, pitch variation and timing of phonetic elements are frequently studied. Information about vowel and consonant reduction is also of interest, with studies looking at the change in the use of the vowel space with change in communicative load. Generally most interest is put into those aspects which are easy to measure and which can be said to be related to the hyper-hypo dimension of information content (see next).
Clear Speech
Recent research has looked at how speech varies in "clarity" according to the communicative context. The idea being that speech itself can be put on an intelligibility dimension: sometimes speech is poorly articulated and hard to understand (hypo-speech) and sometimes it is well articulated and easy to understand (hyper-speech). Hypo-speech is sometimes called "talker-oriented" in that it arises in a situation when the speaker is only concerned with minimising the effort he puts into speaking; while hyper-speech is called "listener-oriented" since it arises in a situation where the speaker is concerned with whether the listener is getting the message.
Where speech is placed along this hypo-hyper dimension can be seen to be influenced by features of the communicative context, as shown in the diagram below:
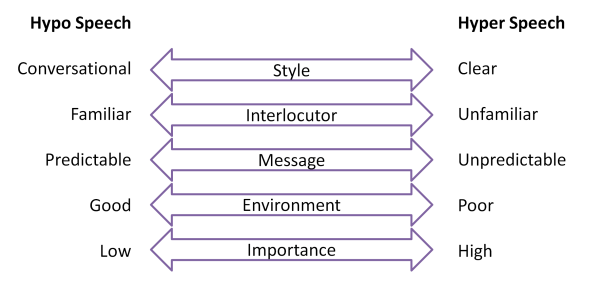
Speech is towards the hypo end of the dimension when you are having a conversation with a friend, the message content is predictable, the acoustic environment is good or the information communicated is not very important. Alternatively, speech is towards the hyper end of the dimension when you are trying to be clear to a stranger, when the message content is novel, the acoustic environment is poor or the information important.
How does speech itself change along the hypo-hyper dimension? To increase the clarity of speech, speakers tend use strategies such as:
- Speaking more slowly
- Articulating segments more carefully
- Raising vocal intensity (by increased lung pressure or by using modal phonation)
- Raising pitch (often an inevitable by-product of increased lung pressure)
- Increasing pitch variation
Which strategies are used to clarify speech can also vary according to further details of the communicative context. In a noisy place one might speak more loudly, but to a child one might speak more slowly.
A recent review of clear speech research can be found in Smiljanić and Bradlow listed in the readings.
- Emotion Variation
Defining emotion
As with styles, it is hard to know whether we should categorise emotions into basic types (the “big six”: anger, fear, sadness, joy, surprise and disgust) or whether to position emotions within an n-dimensional space.
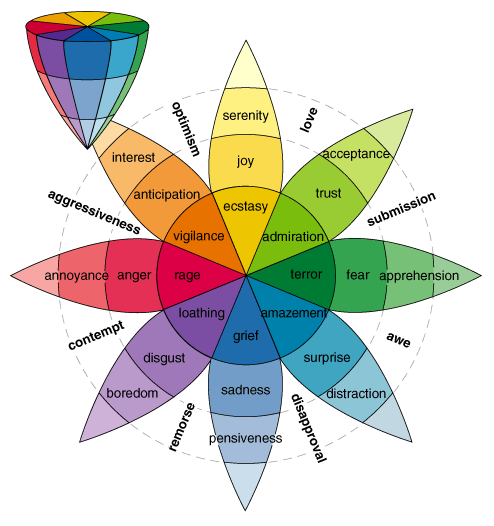
Plutchik’s Emotion Model
In so far as speech is concerned, we find that the same kinds of speech changes occur in a number of different emotions (increased energy or increased pitch for example), so that the space of emotional states that influence speech is probably limited.
Cowie (2001, 2003) proposes just two dimensions, valence and activation. Valence corresponds to the positive or negative aspect of the emotion, while activation relates to “the strength of the person’s disposition to take some action rather than none”. There is some evidence from factor analysis that two-dimensions are necessary, even if they are not sufficient.
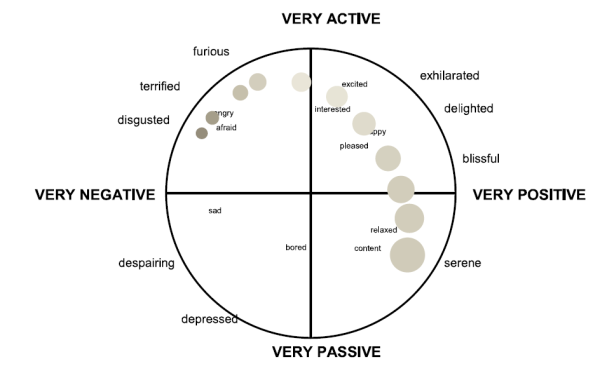
From: R. Cowie & R. Cornelius (2003).
Cowie's model is useful in empirical research into the effect of emotion on speech since listeners can be tasked with rating utterances in terms of the valence and activation of the emotion expressed. These ratings can then be correlated against acoustic properties of the signal to determine what aspects of emotional speech are perceived by listeners.
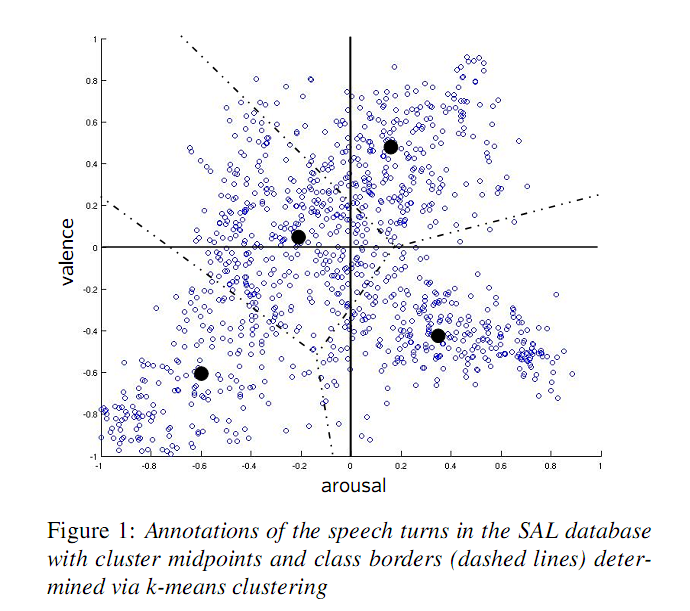
Data from a corpus of emotional speech: M Wollmer, F Eyben, B Schuller, E Douglas-Cowie, R Cowie, "Data-driven Clustering in Emotional Space for Affect Recognition Using Discriminatively Trained LSTM Networks", InterSpeech 2009, Brighton, U.K.
Difficulties in studying emotional speech
The area is fraught with methodological and ethical problems: (i) it is difficult to get recordings of genuine emotions since they occur in natural settings which are unlikely to be recorded (and even then we can’t be sure of the actual emotion felt by the speaker), (ii) it is considered unethical to actually make speakers “afraid” or “panicking” just so we can investigate their speech, (iii) acted speech may caricature rather than express genuine emotions (and actors vary in how well they express emotions), (iv) speakers vary in how they express the same emotion in speech, and (v) speakers expressing an emotional “type” will also differ in the degree of emotional “arousal”.
Acoustic properties of emotional speech
There is a lot of emphasis on how emotional expressions affect the prosody and voice source characteristics of speech. For example this table from Scherer, 2003:
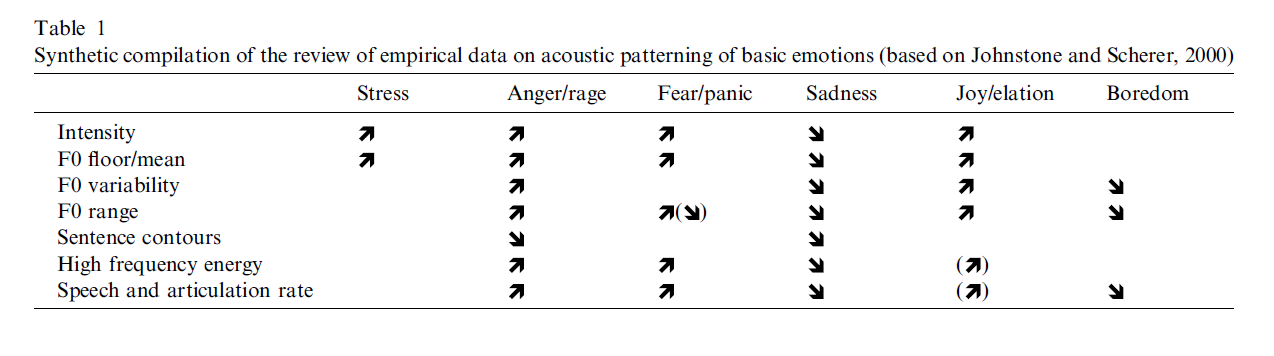
It is worth pointing out that many of these factors may not be independent. Speaking more loudly will increase F0, intensity and high frequency energy. Increased F0 variability will increase F0 range.
- Physiological Variation
The speech produced by a person will be affected by changes in their physical state or their health. For example we notice if a speaker is out of breath, or has a cold. We can also often get a sense of the age of a person from their voice. Broadly speaking we can differentiate between physiological factors in terms of how they affect production: in terms of articulatory planning and control, airflow, larynx physiology or articulator physiology.
We'll look at four areas where researchers have studied the effect of physiological changes on the voice: Stress, Fatigue, Intoxication and Age.
Stress
Although there is no clear definition of "stress", it has been defined as the physiological response of an individual to external stressors subject to psychological evaluation. Physiological response here refers to the invocation of the 'fight or flight' mechanisms of our nervous system, by which adrenalin levels are increased, cardiovascular output is increased, senses are sharpened, pupils are dilated and so on. Stressors include direct physical effects on the body (e.g. acceleration, heat), physiological effects (e.g. drugs, dehydration, fatigue, disease), perceptual effects (e.g. noise, poor communication channel) or cognitive effects (e.g. perceptual load, cognitive load, emotion). Psychological evaluation allow for the fact that an individual's reaction to these stressors may vary according to the individual's evaluation of their importance.
This focus on the physiological response to stressors makes sense with regard to the assessment of stress through characteristics of the voice. It is to be expected that speech, as a neuromuscular performance, will be affected by the physiological state of the individual. For example increased respiration might increase sub-glottal pressure and hence affect the voice fundamental frequency and spectral slope of the voice spectrum. Increased muscle tension might affect vocal fold vibration or the supra-laryngeal articulation of vowels and consonants. Increased cognitive activity might affect speaking rate, pauses or speaking errors.
Early work on the effect of stress on speech was mainly concerned with identifying vocal characteristics that varied with level of stress, without quantitative prediction from signal measurements. Early studies reported changes in the prosodic elements of speech (pitch, stress, timing and speaking rate). Later studies were based on calibrated speech corpora recorded under real or simulated conditions of stress, for example the SUSAS corpus. Given speech materials labelled for levels of stress, signal processing algorithms could now be evaluated for their ability to extract features correlated with stress. Commonly exploited features included voice fundamental frequency, intensity, duration, plus measures of voice quality and spectral energies. Scherer et al (2002) explored the impact of simulated cognitive load and psychological stress tasks on the voice. Although cognitive load did have a significant effect on aspects such as speech rate, energy contour, voice fundamental frequency and spectral parameters, the main conclusions are that individual variability make these unreliable predictors of load or stress.
A recent review of the effects of stress on the voice can be found in Kirchhübel et al, 2011.
Fatigue
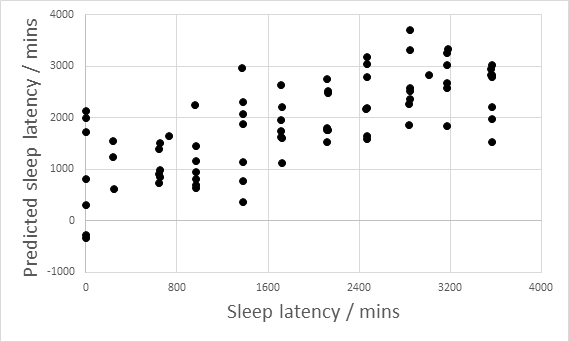
Various speech parameters have been observed to vary systematically with increasing fatigue. Changes in pitch height, pitch variation, speaking rate, pause frequency and length, and spectral slope have been reported. Vogel et al (2010) reported an increase in the total time taken to read a passage, and an increase in pause duration after their subjects had been kept awake for more than 22hours.
The figure below (from Baykaner et al, 2015) shows the results of an experiment to predict time awake from changes in the speaking voice. In this experiment, the speakers were kept awake for 60 hours (three days) and changes to the voice could be used to identify quite accurately whether the speaker had slept in the previous 24 hours. Each point in the graph is a recording of the subject reading from a novel.
Intoxication
Alcohol and other intoxicants have been seen to affect speech. Hollien et al (2001) report increases in fundamental frequency, increases in time to complete the task and increases in disfluencies with increasing alcohol intoxication. The graph below shows mean changes in fundamental frequency for men and women in the study as a function of breath alcohol concentration.
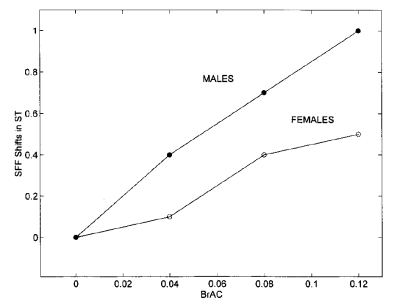
Interestingly, Hollien et al report much variability in how individuals respond to the same level of alcohol intoxication. A significant minority of speakers showed no measurable effects of alcohol intoxication on their speech.
Over the long term, repeated intoxication can have permanent effects on the voice. Alcohol, in particular, causes dehydration of the vocal folds and makes them more susceptible to organic damage.
Age
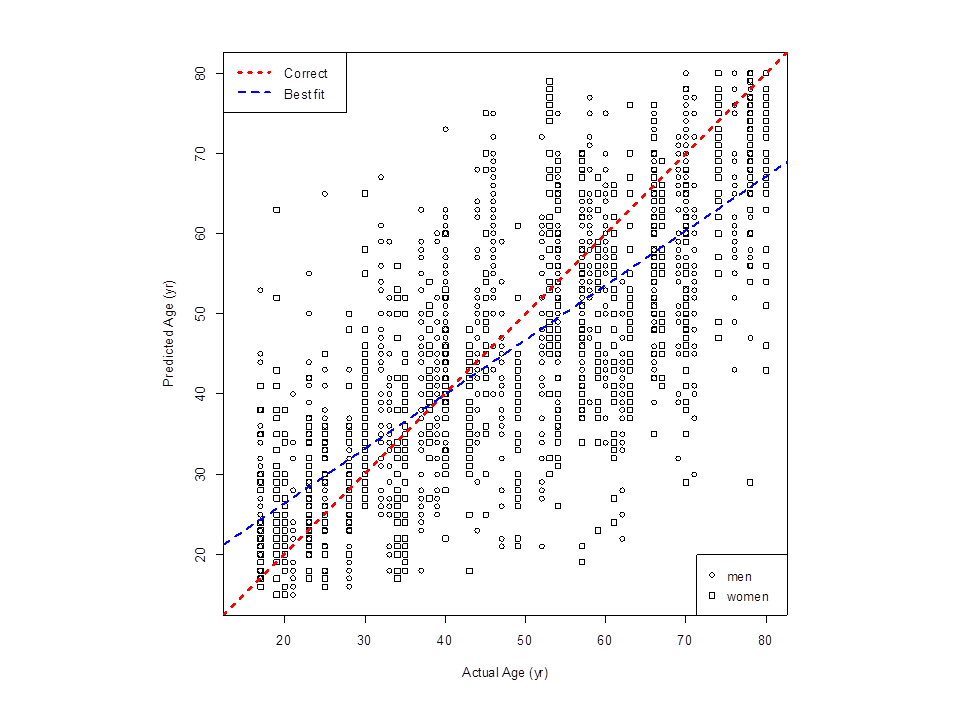
A speaker's voice changes as they get older to the extent to which we can estimate fairly well the age of a speaker from their voice. The figure below (from Huckvale & Webb, 2015) shows the predicted ages of 52 speakers made by 36 listeners. The mean absolute error of age prediction was about 10years, that is we can often estimate a speaker's age within a decade just by hearing their voice.
Difficulties in studying physiological factors
The ethics of changing the physiological state of the speaker need to be considered. Is it appropriate to drug a subject, or deprive them of sleep, or give them a respiratory illness just to observe the effect on their speech? Different subjects will also differ in how much their speech is affected by any physiological change, for example Hollien found a significant minority of speakers showed no effect of alcohol intoxication.
- Measuring Inter-Rater Similarity and Reliability
Whenever multiple subjects are asked to provide opinions about a set of materials, you need to be concerned as to whether their judgements are reliable. One way to do this is to compare raters with each other. If raters tend to agree, then they are presumably expressing genuine opinions.
A number of statistical measures of inter-rater reliability are available. Which to use depends on the nature of the rating task and the number of raters:
Number of raters Nominal scale Ordinal scale 2 raters Percentage agreement
Cohen's KappaCohen's weighted Kappa N raters Fleiss' Kappa
Krippendorff's AlphaKendall’s coefficient of concordance W
Krippendorff's AlphaA nominal scale is one where the responses do not form an ordered scale, for example: anger, fear, sadness, joy, surprise, disgust. An ordinal scale is one where the responses form an ordered sequence, even if the distances between points do not mean anything, for example: excellent, good, fair, poor, bad. To calculate these statistics, you need to collate your ratings into an observations table, such as:
token rater1 rater2 rater3 1 3 3 2 2 3 6 1 3 3 4 4 4 4 6 4 5 5 2 3 6 5 4 2 You can perform reliability testing in "R" using the "irr" library package. In SPSS look under "Analyze | Scale | Reliability Analysis".
What is evidence of reliability? Many authors take a Kappa value or an Alpha value >= 0.8 as evidence of "good" inter-rater reliability. If scores are less than 0.8, further investigation of the cause is necessary - you may want to exclude unreliable raters.
Readings
- M. Eskenazi, Trends in speaking styles research, Proc. EuroSpeech 1993, Berlin, 501-509.
- R. Cowie, Describing the emotional states expressed in speech, ISCA ITRW Speech and Emotion, Newcastle, Northern Ireland, 2001.
References
- Rajka Smiljanić and Ann Bradlow, Speaking and Hearing Clearly: Talker and Listener Factors in Speaking Style Changes
- Scherer, K. R., Vocal communication of emotion: A review of research paradigms. Speech Communication, 40 (2003) 227-256.
- Kirchhübel, C., Howard, D., Stedmon, A., Acoustic correlates of speech when under stress: Research, methods and future directions, The International Journal of Speech, Language and the Law, Vol 18.1 (2011) 75-98.
- A.P. Vogel, J. Fletcher, P. Maruff, Acoustic analysis of the effects of 24hours of sustained wakefulness. Australasian Speech Science and Technology Association conference SST-2010, p142.
- H. Hollien, G. DeJong, C. Martin, R. Schwartz, K.Liljegren, Effects of ethanol intoxication on speech suprasegmentals, J. Acoustic. Soc. Am. 110 (2001) 3198-3206.
- Huckvale, M. A., Webb, A. (2015). A Comparison of Human and Machine Estimation of Speaker Age. Workshop on Statistical Language and Speech Processing, Budapest, November 2015.
- Baykaner, K. R., Huckvale, M., Whiteley, I., Andreeva, S., & Ryumin, O. (2015). Predicting Fatigue and Psychophysiological Test Performance from Speech for Safety-Critical Environments. Frontiers in Bioengineering and Biotechnology, 3.
Laboratory Exercise
- Some samples of acted emotions will be presented in a subjective rating test along the dimensions of Value and Activation. Value varies from "Strongly negative" to "Strongly positive", while Activation varies from "Strongly passive" to "Strongly active". To run the test, start a browser and go to "Laboratory Experiments in Speech Science", then choose "Emotion Rating 1 & 2".
- The class results will be combined into CSV files that you can investigate using SPSS:
- RATER=Listener identifier (derived from IP address of computer)
- SCALE="valence" or "activation"
- STIMULUS=name of audio file
- STIMTYPE=emotion type (fear,anger,joy,boredom,sadness,disgust,neutral)
- RATING=subject rating on scale of -100 to +100
- STIMULUS=name of audio file
- VALENCE=mean valence rating
- ACTIVATION=mean activation rating
- SRATE=syllable rate (z-score)
- FXMEDIAN=fundamental frequency (z-score)
- FXIQR=fundamental frequency range (z-score)
- PPQ5=jitter (z-score)
- HNR=harmonic-to-noise ratio (z-score)
- SPI=soft phonation index (z-score)
- STIMULUS=name of audio file
- R*=one column per rater, showing activation rating for each stimulus
- STIMULUS=name of audio file
- R*=one column per rater, showing valence rating for each stimulus
- With emotion-results.csv, use SPSS to investigate how the listeners used the rating scales. Is there evidence that different listeners used the rating scales differently? (you might plot box plots of the ratings against speaker).
- With emotion-rating-valence.csv and emotion-rating-activation.csv, use SPSS to calculate some inter-rater reliability coefficients to check whether the listener judgments can be relied upon.
Inter-rater reliability can be found under Analyze | Scale | Reliability Analysis. Under options, select the "intraclass correlation coefficient". The "single measure" coefficient shows the average reliability one one rater, while the "average measure" coefficient shows the reliability of the group of raters as a whole. What differences in inter-rater reliability do you observe between the two scales. Why might that be?
- Using emotion-results.csv, plot the distribution of all VALENCE ratings as a function of emotion category. Do you see evidence of systematic variation? Which categories have most variance?
- Using emotion-results.csv, plot the distribution of all ACTIVATION ratings as a function of emotion category. Do you see evidence of systematic variation? Which categories have most variance?
- Using emotion-results.csv, compute the mean ACTIVATION and VALENCE over all raters and stimuli for each stimulus type, then plot a scatterplot of the emotion categories on axes of ACTIVATION and VALENCE.
To compute a table of mean ratings, use Data | Aggregate with SCALE and STIMTYPE as the break variables and calculate the mean RATING for each combination into a new data set. You can then add columns for mean Valence and and mean Activation for each STIMTYPE by cutting and pasting.
- Using emotion-mean-audio.csv, calculate the correlation of the mean ACTIVATION rating against the acoustic properties. Do you see any evidence of systematic variation? Plot a scatter graph and test the significance of any promising correlations. Why do you think these acoustic properties are useful for rating activation?
- Using emotion-mean-audio.csv, calculate the correlation of the mean VALENCE rating against the single acoustic properties. Do you see any evidence of systematic variation? Plot a scatter graph and test the significance of any promising correlations. Why do you think these acoustic properties are useful for rating valence?
- Listen again to some emotional speech recordings, which can be found in y:/EP/emotion, and suggest some other acoustic features, not covered above, that might be useful in discriminating emotional valence.
emotion-results.csv - All raw rating judgements, with fields:
emotion-mean-audio.csv - Mean ratings per audio stimulus plus acoustic analyses, with fields:
emotion-rating-activation.csv - Comparison of activation ratings across raters:
emotion-rating-valence.csv - Comparison of valence ratings across raters:
Reflections
- What are the characteristics of "careful" speech compared to "casual" speech? Which of these would be easy to measure?
- What are the benefits (for experimental methodology) of an N-dimensional model of style (or emotion) compared to one based on discrete categories?
- How might you record people talking at different speaking rates?
- How might you (ethically) record people expressing the emotions: anger, fear, sadness, joy, surprise and disgust?
- How might you (ethically) record the effect of dehydration on speech?
Word count: . Last modified: 14:32 08-Mar-2017.