UNIT
6:
WINDOWING
Summary
This
unit considers the consequences of analysing sections or 'windows' of a
continuous signal, and how the use of smoothing functions reduces the spectral
artifacts introduced.
When you have worked through this unit you should:
· be able to state why and
when spectral leakage occurs
· understand how a smooth
window reduces the amount of spectral leakage
· be able to describe and
apply a Hamming window in your own work
Concepts
Where
the frequency components of signals we analyse with the DFT are exact harmonics
of the DFT analysis, the resulting spectrum shows clean spectral lines. Since mostly the signals we want to analyse
will not contain just these harmonics, we find that the energy at one input
frequency is spread to a number of nearby harmonics in the DFT. This is called spectral leakage.
A
similar problem arises for signals which are changing with time, where we
usually want to analyse a 'snapshot' of the signal, short enough in which we
could consider the generating system to be 'stationary'. To do this we must take a sample or a window of the signal over some defined
interval. If we simply cut out a
section of the signal, however, we introduce artifacts into the waveform - namely
the sudden onset and offset - which will be manifested as distortions in our
spectral analysis. What is happening is
that our spectrum results from the convolution of the signal spectrum with the
spectrum of a rectangular
window. The spectrum of a rectangular
window has the familiar sin(x)/x shape or sinc
function, and so each signal component is broadened by this shape.
We
can reduce these distortions by ensuring that the section has no sudden onset
or offset, which we can do by multiplying our section with a smoothing function
which reduces the size of the signal at the edges. We need a shape which has a spectrum with a narrow central lobe
and small sidelobes. A window based on
a raised-cosine shape called the Hamming window is a common compromise:
|
|
Where
N is the number of samples in the section.
See Hamming().
Algorithms
|
// window.cpp -- Hamming window functions // // C++ (c) 1996 Mark Huckvale University College London #include "tools.h" #include "window.h" // apply hamming window to a waveform Waveform Hamming(const Waveform& iwv) { Waveform owv(iwv.count(),iwv.rate()); double omega = 2.0 * PI / (iwv.count()-1); for (int i=1;i<=owv.count();i++) owv[i] = (0.54 - 0.46 * cos(omega*(i-1))) * iwv[i]; return owv; } // apply hamming window to a complex waveform ComplexWaveform Hamming(const ComplexWaveform& iwv) { ComplexWaveform owv(iwv.count(),iwv.rate()); double omega = 2.0 * PI / (iwv.count()-1); for (int i=1;i<=owv.count();i++) owv[i] = (0.54 - 0.46 * cos(omega*(i-1))) * iwv[i]; return owv; } |
Bibliography
Lynne & Fuerst Introductory Digital Signal
Processing, Section 8.2.2
Example Program 6.1
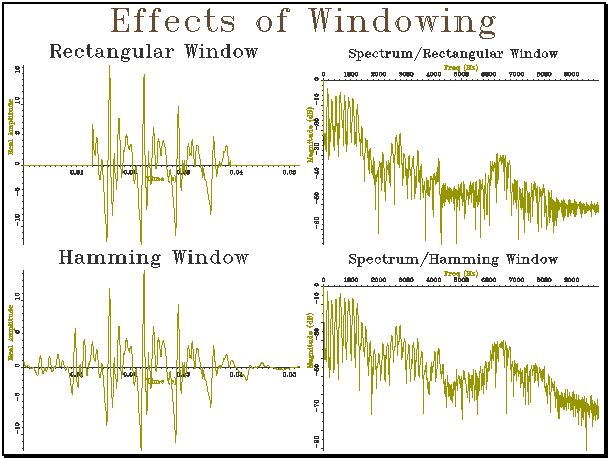
|
// window_t.cpp -- demonstration of windowing #include "tools.h" #include "quantise.h" #include "cfft.h" #include "window.h" #include "annot.h" const char *FILENAME="/users/mark/trial”; const char *SPITEMNO="sp"; const char *ANITEMNO="an"; const char *ANLABEL="V"; // load waveform sample from test signal ComplexWaveform ReadSample() { // read in annotation AnnotationList anlist; if (anlist.load(FILENAME,ANITEMNO)!=0) { cerr << "Could not find annotations\n"; exit(0); } // find annotation Annotation an = anlist.find(ANLABEL); if (!an.name) { cerr << "Could not find annotation\n"; exit(0); } // load appropriate section Signal isig(1,1.0); isig.load(FILENAME,SPITEMNO,an.posn,an.size); // convert to waveform then complex Waveform iwv = MakeCont(isig,0.001); ComplexWaveform cwv = WaveformToComplexWaveform(iwv); return cwv; } int
main() { // set up graphs Graph gr(2,2,"Effects of
Windowing"); // load sample waveform ComplexWaveform wv1 = ReadSample(); // apply rectangular window and plot for (int i=1;i<=wv1.count()/4;i++)
wv1[i]=0.0; for (int i=(3*wv1.count())/4;i<=wv1.count();i++)
wv1[i]=0.0; wv1.plotReal(gr,1,"Rectangular
Window"); // FFT without windowing and plot Spectrum sp1 = ComplexFFT(wv1); (sp1.half()).plotLogMag(gr,2,"Spectrum/Rectangular
Window"); // apply Hamming window and plot ComplexWaveform wv2 =
Hamming(ReadSample()); wv2.plotReal(gr,3,"Hamming
Window"); // FFT with Hamming window and plot Spectrum sp2 = ComplexFFT(wv2); (sp2.half()).plotLogMag(gr,4,"Spectrum/Hamming
Window"); gr.close(); } |
Exercise
6.1 Adapt Example 6.1 to plot the waveforms
and FFT spectra of sine waves at Fs/4 (exact) and Fs/6
(non-exact) harmonic frequencies with rectangular and Hamming windows. Use a short FFT of about 128 samples. Interpret the results.