Wells, A study of the formants of the pure vowels of British English
IV. Relative amplitude
[SAMPA] [Table 5 and illustrated in fig. 6.
The spectrograph does not enable one to measure directly the amplitude of a formant, but only the amplitude of its loudest harmonic. This means that the amplitude figures for a given formant vary widely, and no very great degree of accuracy is possible in the determination of formant amplitudes. In view of this consideration, it is not felt that the wrighting-compensation procedure outlined above can reasonably be objected to.
The amplitude readings from one subject's pronunciation were rejected as unusable. Two other subjects' pronunciations had been analysed without any frequency/amplitude weighting: this was allowed for in the amplitude calculations, but the F3 amplitude readings were unusable. The relative amplitude figures given, therefore, are based upon the pronunciation of 24 speakers (F1 and F2) or 22 speakers (F3).
 Where F3 failed to come up in the spectrogram section (and its frequency therefore had to be measured from the frequency/time display), its amplitude was taken as zero with respect to the amplitude baseline, although certainly its amplitude would in fact be somewhere below zero. This means that some of the quoted F3 relative amplitude figurs may err on the generous side: F3 may be of rather less mean relative amplitude than stated, particularly in the case of /O/ and /u/, the vowels whose F3's most frequently failed to come up in the spectrogram sections.
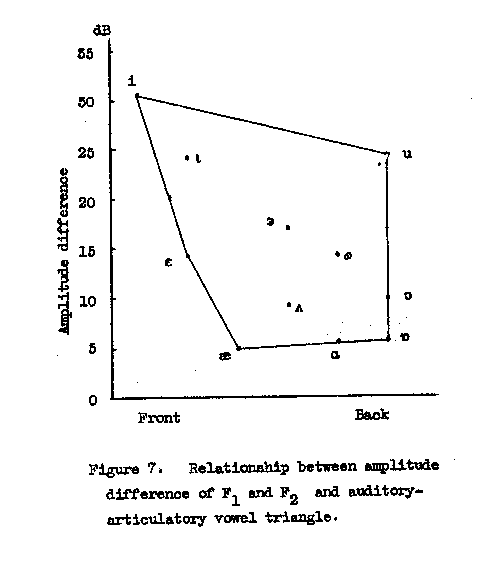
As, it seems, with most acoustic vowel parameters, it is possible to manipulate the figures in such a way as to show correlation with tongue height and yield an acoustic triangle similar to the familiar auditory-articulatory triangle -- in this case by plotting as the ordinate the difference in amplitude between F1 and F2, with the abscissa arbitrarily arranged to bring out the similarity (fig. 7). In other words, high tongue position corresponds to an F2 of much less intensity than F1, while low tongue position corresponds to an F2 of intensity similar to that of F1. As far as /V/ is concerned, this amplitude triangle gives a better positioning (that is, a positioning more like the auditory-articulatory positioning) than any other acoustic plot, not excluding the frequency plot of F1 versus F2.
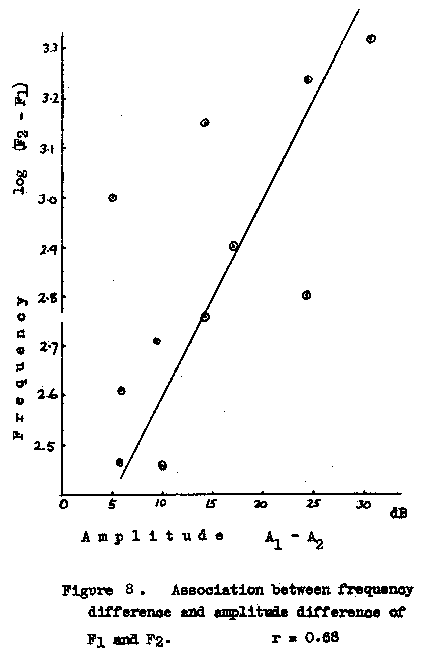
Association between frequency difference and amplitude difference for F1 and F2
In fig. 8 the difference in mean amplitude between the first and second formants for each vowel is plotted against the logarithm of the mean difference in frequency. It will be seen that there is a positive correlation between the two, though not of a particularly high order (r = 0.68) [32, p.286].
Comparison with General American
Inspection of Table 5 shows the RP formant amplitudes found to be fairly similar to those reported for General American by Peterson and Barney [37]. (It should, however, be noted that Peterson has since stated [34] that "it was found ... [in a repeat experiment] that the higher formants for the vowels of the matching data were not as low in amplitude as those in the Peterson and Barney study.")
The closest similarity between Gen.Am. and RP is for /E/, where the figures are virtually identical; the greatest discrepancy, as expected, is in the F3 of /3/ (Gen.Am. /3`/). An unexpected feature of the RP figures is the comparatively great amplitude found for F1 of /I U u/.
As was the case with frequency, so also with amplitudes there is greater similarity between Gen.Am. /O/ and RP /Q/ than between Gen.Am. /O/ and RP /O/, which latter has a particularly low-amplitude F3.
Contents