9. Experimental Data Visualisation
Learning Objectives
By the end of the session you should:
- know how to use the Flotr2 library for creating simple plots
- know how to use the Highcharts library for creating simple plots
- know how to create graphics using canvas graphics
Topics
- Graph plotting
Flotr2
The Flotr2 graph plotting library is a set of Javascript objects and functions for plotting simple data plots and charts. It is open source and free to use.
The Flotr2 library supports all major browsers including mobile, and can produce scatter plots, line plots, bar plots and pie charts.
To use Flotr2 you only need to download one javascript file flotr2.min.js and include this in your web page with:
<script src="flotr2.min.js"></script>
You then allocate a region of your web page where your graph is to be drawn. Typically this will be a div element.
<div id="mygraph"></div>
and you can set the style and size of the element with CSS:
<style>
#mygraph {
   width: 500px;
   height: 300px;
   background-color: #EEFFFF;
}
</style>
To draw a graph in the div element you first need to prepare your data in the format required by the Flotr2 library. For x-y plots, each series should be represented by an array of [x,y] values, for example:
var d1 = [[0, -2], [4, 2], [8, 1.5], [10, -1.5], [12,0]];
var d2 = [];
for (var i = 0; i < 4*Math.PI; i += 0.25)
   d2.push([i, Math.sin(i)]);
Here variable d1 is simply initialised to the [x,y] values directly, while d2 is set using a for loop calling the Math.sin() function.
Lastly, you can call the Flotr2 library specifying the data series and the div element for display.
Flotr.draw(document.getElementById("mygraph"), [ d1, d2 ]);See how the two data series are themselves supplied in an array object as the second function argument,
The Flotr.draw() function can take a third argument that gives you control over exactly how the graph is drawn. This gives you control over the labelling of the axes, the minimum and maximum values drawn, whether data values are plotted as points or lines, and what plotting symbol to use. You can also control the colours and fonts.
Here is an example:
Flotr.draw(container, [ data ], {
   title : "Waveform",
   shadowSize : 0,
   xaxis : {
      title : "Time (s)"
   },
   yaxis : {
      title : "Amplitude",
      titleAngle : 90,
      min : -1,
      max : 1
   },
   HtmlText : false
} );
Here is a description of some of the graph properties that can be set:
Property Sub-property Description title Main title subtitle Sub title fontColor Labels font colour fontSize Labels font size shadowSize Size of shadow under plot line (pixels) HtmlText Control how text is drawn (true/false) xaxis/yaxis X or Y axis properties title title titleAngle title text angle (degrees) min minimum axis value max maximum axis value grid Background grid properties color grid line colour verticalLines vertical grid lines (true/false) horizontalLines horizontal grid lines (true/false) Look at demo9-1.html and demo9-2.html for worked examples. Refer to the Flotr2 documentation for further parameters and default settings.
High Charts
The Highcharts graph plotting library is another pure Javascript library for plotting graphs. It has more options than Flotr2 and is a little more complex to use. Highcharts is a commercial product, but is free for personal use.
The Highcharts library supports all major browsers including mobile, and can produce scatter plots, line plots, bar plots, pie charts, boxplots and many specialised plots.
To use Highcharts you need to download a JavaScript library configured for your use. You do this from the Highcharts download page by answering a series of questions. This gives you a script file which only contains the functionality you need. You then include this into your web page in the usual way:
<script src="highcharts-custom.js"></script>
The use of the Highcharts libary is similar to Flotr2. You create and style a div element then prepare your data series and call a single Highcharts function to render the graph to that element. The entire specification for the graph is passed to Highcharts as a JavaScript structure with many properties, for example:
var d1 = [[0, -2], [4, 2], [8, 1.5], [10, -1.5], [12,0]]; var d2 = []; for (var i = 0; i < 4*Math.PI; i += 0.25) d2.push([i, Math.sin(i)]); var chart1 = new Highcharts.Chart({ chart: { renderTo: 'mygraph', // name of div element type: 'line' }, title: { text: 'Main Title' // main title for graph }, xAxis: { title: { text: 'X-axis label' // x-axis label } }, yAxis: { title: { text: 'Y-axis label' // y-axis label }, }, series: [{ data: d1 }, { data: d2 } ] // data series });Highcharts charts are very customisable. For a worked example, see demo9-3.html. Refer to the Highcharts documentation for full details.
- Canvas graphics
If you require graphical elements not supported by HTML or the graph plotting libraries, an alternative is to use canvas graphics, which provides a general purpose drawing functionality within Javascript.
Using canvas graphics means that you take complete control of all the graphical elements: lines, shapes, text, images and their exact form and position on the page. Although this gives a lot of flexibility, it requires much more programming to achieve a simple graph. Only resort to canvas graphics if other means for meeting your requirements cannot be found.
The graphics context object
The functionality for canvas graphics comes from the canvas graphics context object. You need to create a graphics context for each graph on your web page. You do this in three steps: (i) create a canvas HTML element on your page, (ii) obtain a reference to the canvas object within javascript, and (iii) request the graphics context from the canvas object. Here is some example code:
<html>
  <head>
    <meta charset="utf-8"/>
    <title>Canvas tutorial</title>
    <script type="text/javascript">
      function draw(){
        var canvas = document.getElementById('tutorial');
        if (canvas.getContext){
          var ctx = canvas.getContext('2d');
          // ... add your drawing code here
        }
      }
    </script>
    <style type="text/css">
      canvas { border: 1px solid black; }
    </style>
  </head>
  <body onload="draw();">
    <canvas id="tutorial" width="150" height="150"></canvas>
  </body>
</html>
The important elements to see here:
- the canvas HTML element on the web page, with an id, width and height specified.
- the draw() function which is called from the onload event of the body element.
- inside the draw() function, we obtain a reference to the canvas object by its ID.
- from the canvas object we request the relevant graphics context for the canvas.
- we can now use the graphics context object ctx to draw on the canvas.
Basic usage
The co-ordinate system for canvas graphics works like this:
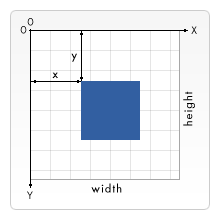
You draw on the canvas by setting properties of the context object (such as the colours, line widths, font, drawing position) then calling methods for creating lines, rectangles and ellipses, or for drawing text.
Drawing a rectangle
There are three methods that draw rectangles:
fillRect(x, y, width, height) Draws a filled rectangle strokeRect(x, y, width, height) Draws a rectangular outline clearRect(x, y, width, height) Clears the specified rectangular area, making it fully transparent To set the colour and/or transparency of the rectangle, set the fillStyle property to the required colour. All the methods of specifying colours in CSS are supported.
Here is a simple example:
<script> function draw() { var canvas=document.getElementById("canvas"); var ctx=canvas.getContext('2d'); ctx.fillStyle="rgb(200,0,0)"; ctx.fillRect(10,10,50,50); ctx.fillStyle="rgba(0,0,200,0.5)"; ctx.fillRect(30,30,50,50); } </script> ... <canvas id="canvas" width="100" height="100"></canvas> <button onclick="draw()">Draw Graph</button>Drawing a line
To draw a line requires a series of steps: (i) specify the line colour and thickness, (ii) start a new drawing path, (iii) move to the first point on the path, (iv) repeatedly specify the path from the last point to the next point in turn, (v) close the path (if required), (vi) request that the path be drawn or filled.
The properties and methods you will need are:
strokeStyle Line colour fillStyle Fill colour lineWidth Line width beginPath() Start new path moveTo(x,y) Move to first point on path lineTo(x,y) Draw line to next point on path closePath() Connect up to the first point on path stroke() Draw a line (using strokeStyle) fill() Fill in the shape (using fillStyle) Here is a simple example:
<script> function draw() { var canvas=document.getElementById("canvas"); var ctx=canvas.getContext('2d'); // Filled triangle ctx.fillStyle="blue"; ctx.beginPath(); ctx.moveTo(10,10); ctx.lineTo(80,10); ctx.lineTo(10,80); ctx.fill(); // Stroked triangle ctx.strokeStyle="red"; ctx.lineWidth=3; ctx.beginPath(); ctx.moveTo(90,90); ctx.lineTo(90,20); ctx.lineTo(20,90); ctx.closePath(); ctx.stroke(); } </script> ... <canvas id="canvas" width="100" height="100"></canvas> <button onclick="draw">Draw Graph</button>Drawing a circle
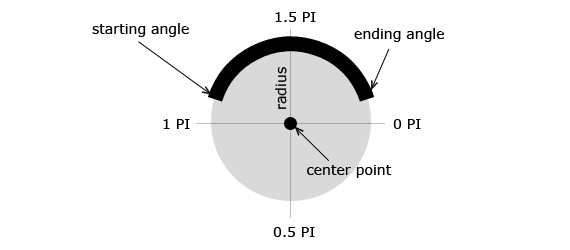
To draw a circle, use the arc() method:
arc(x, y, radius, startAngle, endAngle, anticlockwise)
The x and y values specify the centre of the circle and radius its size. The startAngle and endAngle parameters specify the starting and ending angles as measured the positive x-axis; angles are measured in radians. The final optional argument specifies whether the angles are defined clockwise (default) or anti-clockwise.
Here is a simple example:
<script> function draw() { var canvas=document.getElementById("canvas"); var ctx=canvas.getContext('2d'); ctx.beginPath(); ctx.arc(50,50,45,0,Math.PI*2,true); // Outer circle ctx.moveTo(80,50); ctx.arc(50,50,30,0,Math.PI,false); // Mouth (clockwise) ctx.moveTo(45,40); ctx.arc(40,40,5,0,Math.PI*2,true); // Left eye ctx.moveTo(65,40); ctx.arc(60,40,5,0,Math.PI*2,true); // Right eye ctx.stroke(); } </script> ... <canvas id="canvas" width="100" height="100"></canvas> <button onclick="draw()">Draw Graph</button>Drawing some text
To draw text on the canvas you can specify the font family, size, weight, alignment, colour and whether you want filled or outline characters.
The font property alllows you to set the font style, weight, size and family just as you would in CSS:
ctx.font="font-style font-weight font-size font-face"
for example
ctx.font="italic bold 36px Arial";
The textAlign property controls where the text is drawn with respect to the given co-ordinates:
left XY specifies the bottom left of the text string center XY specifies the bottom centre of the text string right XY specifies the bottom right of the text string for example:
ctx.textAlign="center";
Filled text is drawn with the fillText() function, and outline text with the strokeText function. The filled colour is specified with the fillStyle property, and the stroked colour is specified with strokeStyle property.
void fillText( text, x, y);
void strokeText( text, x, y);
Here is a simple example:
<script> function draw() { var canvas=document.getElementById("canvas"); var ctx=canvas.getContext('2d'); ctx.font = "normal 32px Times"; ctx.fillStyle = "#000080"; ctx.fillText("HTML5 Canvas Text", 10, 40); ctx.font = "bold 32px Verdana"; ctx.strokeStyle = "#008000"; ctx.strokeText("HTML5 Canvas Text", 10, 80); } </script> ... <canvas id="canvas" width="400" height="100"></canvas> <button onclick="draw()">Draw Graph</button>Refer to demo9-4.html for a complete worked example of canvas graphics.
Resources
- Data visualisation with Javascript e-book.
- Flotr2 library.
- Highcharts library.
- Canvas graphics tutorial.
- Local copies of the plotting libraries can be found at:
- http://www.phon.ucl.ac.uk/courses/spsci/webprog/include/flotr2.min.js
- http://www.phon.ucl.ac.uk/courses/spsci/webprog/include/highcharts-custom.js
Exercises
- Implement "X-Y scatter plot with regression line" demonstration (demo9-1.html).
- Implement "Histogram bar chart" demonstration (demo9-2.html).
- Implement "Boxplot" demonstration (demo9-3.html).
- Implement "Canvas Graphics" demonstration (demo9-4.html).
Homework
- You should aim to have a working version of your web experiment ready before next week's class. We will use the final class time to fix any last-minute bugs and to try out each other's experiments.
- You should also make progress on your coursework web site. You should have at least created a welcome page with a contents menu and a scientific background page. You could create empty "holding" pages for the rest of the content pages, maybe with a few notes about what is needed for each page.
Word count: . Last modified: 10:49 01-Dec-2017.