5. Measuring Vowel Quality
Learning Objectives
- to learn about different measures for estimating the spectral envelope of vowels
- to learn about different way to parameterise the spectral envelope, including formant frequencies
- to learn about speaker normalisation procedures for vowel measurements
- to gain experience with methods and problems related to collecting vowel measurements from a corpus
- to gain experience with statistical procedures for correlation, multivariate comparison of means, and random effects.
Topics
- Why study vowel quality?
Vowels are relatively easy to measure elementary sounds of speech, and their form reflects the phonological choices for syllable nuclei used by the speaker and provides information about constraints on their variability in context. The phonetic character of vowels can provide you with information about the speaker and about their accent. Much sociolinguistic research has focussed on how vowels vary within a population and how they vary across time. The ways in which speakers exploit the vowel space available to them has also been used in studies of speaking style.
- Phonology, Phonetics and Acoustics
The term "vowel" itself is highly ambiguous. When we talk of "a vowel" are we referring to the selectional choice for a syllabic nucleus of some word in some accent, or the choice chosen by one individual in their mental lexicon, or a particular class of articulations without regard to context, or one specific articulation in context, or to the acoustic form of the sound, or to the timbre of the perceived vowel quality?
Experimentally we might research vowels by first transcribing them then analysing the distribution of the transcribed symbols across accents, speaking styles, etc. The advantage of this approach is that you can use the ability of the human listener to focus on the vowel properties that are significant for the research question, without being distracted by things like pitch, loudness, speaking rate, vocal tract length or contextual variation. The disadvantage of this approach is that transcribers may be insensitive to small but significant systematic effects or may be biased because of their own native language preferences. Manual transcription is also a slow and error-prone process.
As an alternative one can use signal analysis methods to make measurements of vowel quality from annotated recordings. This can be fast and cheap to perform and provides objective measurements. However the measurements may be corrupted by many factors such as the physical size of the speaker, the phonetic context, speaking rate, measurement errors, or the signal-to-noise ratio of the recording. The challenge is to extract useful information about vowel quality in the presence of these interfering factors.
- Estimating the spectral envelope
Three main techniques are found for estimating the spectral envelope from the signal: using a filterbank, using linear prediction, and using cepstral analysis.
A filterbank is a bank of band-pass filters each of which isolate a particular frequency region of the signal. The energy at the output of each filter channel can be estimated by rectification, smoothing and down-sampling. A filterbank brings a great deal of flexibility to spectral analysis, since the filters need not be equally spaced, nor have constant bandwidth. A common filterbank design is modelled on auditory filter bandwidths and spacing which gives greater spectral resolution in the lower frequencies (Holmes, 1980). Such a design is not far from a one-third octave (or one-tenth decade) filterbank used in acoustical engineering, where each filter is of constant bandwidth in log Hz. A one-third octave filterbank would represent the spectrum between 100Hz and 8000Hz in 19 channels.
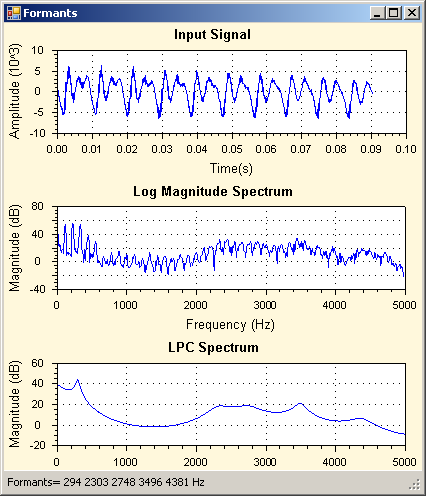
A linear predictor is a system learned from the signal that recreates the observed signal from an input and a filter, on the assumption that the input signal has a flat spectrum and that any peaks in the observed signal spectrum were caused by the filter. These assumptions work pretty well for speech. The power of linear prediction is that we can use the frequency response of the estimated filter to characterise the spectral envelope of the signal. To represent the spectral envelope of a speech signal up to 8000Hz, predictors typically have 16-18 prediction coefficients.
Cepstral analysis is a technique that smoothes the signal spectrum by removing the fine harmonic structure leaving the slowly-varying envelope behind. The cepstrum is first computed as the spectrum of the log power spectrum of the signal, then all but the first few cepstral quefrencies are set to zero amplitude and the inverse spectral transform applied to recover the smooth spectrum. It has been found that around 12-20 cepstral coefficients are needed to represent the envelope for speech. Indeed, a variation called mel-frequency cepstral coefficients (MFCC) are probably the most popular form of spectral envelope representation used in speech recognition.
 ̆
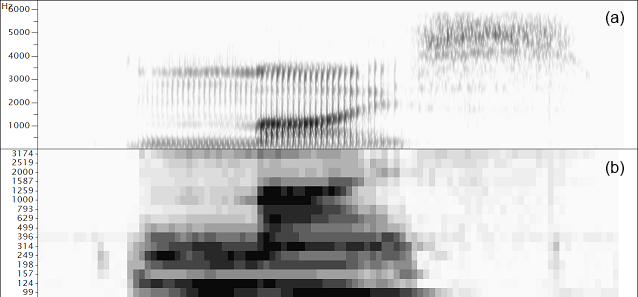
̆Comparison of spectral envelope representations for the word "mice". (a) Wide-band spectrogram (DFT), (b) third-octave filterbank, (c) Linear prediction spectrogram, (d) Formant frequencies, (e) Mel-frequency cepstral coefficients.
- Formant frequency estimation
Once the spectral envelope has been estimated for each time interval in the signal (analysis of typically 20-30ms sections, repeated 100 times/second) further computation is often performed to derive a small set of parameters which describe the important properties of the envelope over that interval.
Since it is the locations in frequency of the peaks of the spectrum that contribute most to the perceived timbre, an obvious first choice is to reduce the envelope to a few numbers representing the location and shape of the peaks. It is very likely that for vowel sounds at least some of the peaks in the envelope will correspond to resonances of the vocal tract, that is, to formants. Unfortunately the mapping can be rather unreliable, so one cannot rely on the fact that, for example, the lowest spectral peak corresponds to F1, or that adjacent peaks correspond to adjacent formants. Automatic algorithms employ heuristics to find good mappings between peaks and formants, but faulty assignments should always be considered a possibility. Thus when averaging across time, one might prefer a median formant frequency over a mean to avoid the problem of incorrect assignments.
- Statistically-derived dimension reduction
Spectral envelopes can also be represented in fewer parameters through statistical analysis such as Principal Components Analysis (PCA) or Linear Discriminant Analysis (LDA). In these techniques a corpus of envelopes measured along N dimensions is analysed to derive a set of new dimensions smaller than N which are linear combinations of existing parameters but which capture useful variability in the data. This processing is useful not only because it reduces the dimensionality of the data, but because the new dimensions are also statistically independent, which helps subsequent modelling. These new coefficients can be used as an alternative to formant frequencies for a given data set, see the example below:


Discrimination of vowel qualities using different spectral envelope parameters. Measurements of 4 long monophthongal vowels from one speaker are plotted (a) in terms of the distribution of the first and second formant frequencies, (b) in terms of the first two linear discriminants calculated over all monophthongal vowels using the first three formants, (c) in terms of the first two linear discriminants calculated over all monophthongal vowels using a third-octave filterbank, (d) in terms of the first two linear discriminants calculated over all monophthongal vowels using mel-scaled cepstral coefficients. Discrimination by formant frequencies alone is quite good, and not improved by discriminant analysis. However discrimination is improved by the use of third-octave energies or MFCCs.
- Vowel Measurement Techniques
Normalisation
To compare vowel realisations across speakers we need to take into account the vowel space of the speaker. Many methods for vowel formant frequency normalisation have been proposed (see Adank, 2004). A simple method is to convert the hertz values for a speaker into z-scores using the mean and standard deviation of F1 and F2 found for that speaker.
The graphs below compare a set of vowels from 50 speakers (a) Unnormalised, (b) Normalised by the height of the speaker, and (c) normalised using z-scores for each speaker separately.
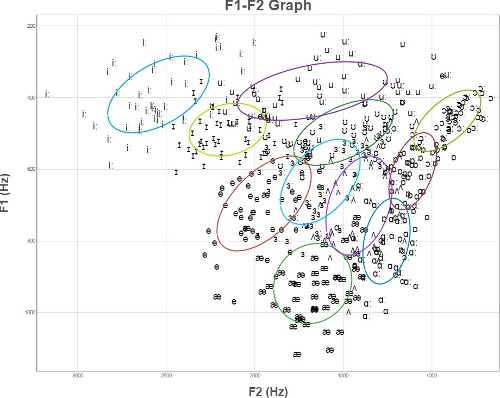
(a) Raw F1 & F2 frequencies from 50 speakers of 11 British English vowels.
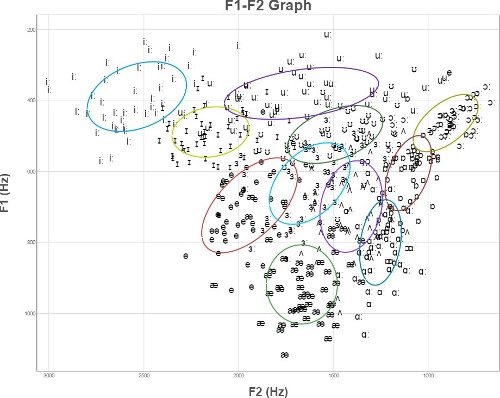
(b) F1 & F2 frequencies normalised by speaker height.
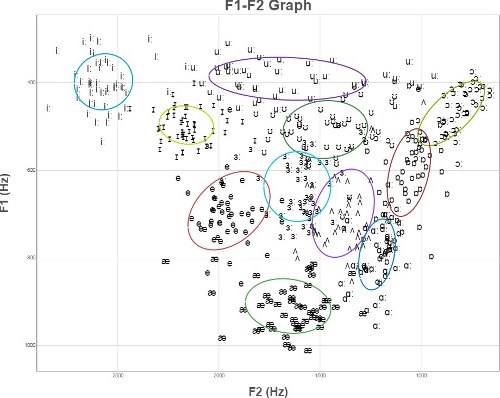
(c) F1 & F2 frequencies normalised to have same mean and standard deviation for each speaker.
Computing Vowel Area
One potentially useful measure of a speaker's intelligibility is their vowel area. This is the size of the acoustic space used by the speaker, and has been shown to vary within a speaker across speaking styles.
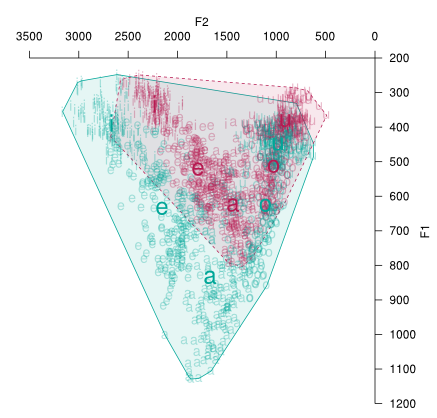
To compute a vowel area, the sample vowels are plotted on a two-dimensional graph and the outermost points connected with lines to form the smallest area that contains all the points. This is called finding the convex hull. The area of this shape may then be computed by resolving it into a series of triangles and using geometry to find their area. Fortunately scripts exist to perform the arithmetic calculation (e.g. the PhonR package).
As a point of interest it doesn't make much sense to compute the area in hertz2, since a shift of 50Hz along the F2 axis is much less significant than a shift of 50Hz along the F1 axis (this is because our hearing is more selective of frequency at lower frequencies). A convenient alternative is to convert the hertz values onto some auditory scale, where equal steps along the scale are roughly equal steps of perceived difference. Once such scale is the Bark Scale. The conversion formula is given below:
bark = 13 arctan(0.00076 f) + 3.5 arctan((f/7500)2)
Multivariate hypothesis test
To a good approximation, vowel qualities differ along two basic dimensions. It can be useful, therefore, to be able to compare the sample means for two vowels along two dimensions simultaneously. For example, to differentiate /iː/ from /ɪ/ it may be necessary to take into account both differences in F1 and differences in F2. Rather than apply a t-test to F1 and F2 separately, one might apply a multivariate version of the t-test to both at once, which is called Hotelling's T2 test:
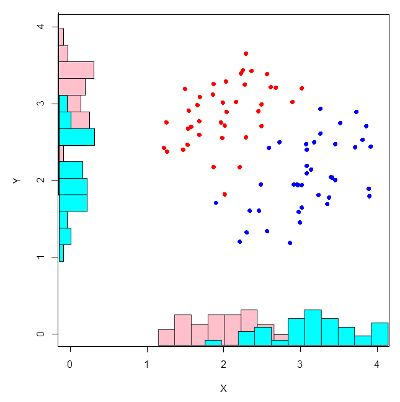
Hotelling's T2 test. Two samples measured on two properties may have significantly different centroids in two dimensions without either property being significantly different along each dimension taken separately. By using a multivariate test, both properties are taken into account at the same time.
References
- Fant, G., Acoustic Theory of Speech Production, Mouton: The Hague, 1970.
- Holmes, J., JSRU Vocoder, IEE Proceedings F, Communications, Radar and Signal Processing, 127 (1980) 53-60.
- Markel, J., Gray, A., Linear Prediction of Speech, Springer-Verlag, 1982.
Readings
- Peterson, G., Barney, H., “Control methods used in the study of vowels”, J. Acoustic. Soc. Am. 24 (1952) 175-184. [on Moodle]
- Adank P, Smits R, van Hout R., “A comparison of vowel normalization procedures for language variation research”. Journal of the Acoustical Society of America, 116 (2004), 3099-3107. [on Moodle]
- Huckvale, M., How To: Phonetic Analysis using Formant Measurements
Table of formant frequencies of British English vowels
| Vowel | F1 (Hz) | F2 (Hz) | F3 (Hz) |
|---|---|---|---|
| iː | 285 | 2373 | 3088 |
| ɪ | 356 | 2098 | 2696 |
| e | 569 | 1965 | 2636 |
| æ | 748 | 1746 | 2460 |
| ɑː | 677 | 1083 | 2340 |
| ɒ | 599 | 891 | 2605 |
| ɔː | 449 | 737 | 2635 |
| ʊ | 376 | 950 | 2440 |
| uː | 309 | 939 | 2320 |
| ʌ | 722 | 1236 | 2537 |
| ɜː | 581 | 1381 | 2436 |
Adult male formant frequencies in Hertz collected by J.C.Wells around 1960. Note how F1 and F2 vary more than F3.
Laboratory Exercises
To run these exercises, you need to run CYGWIN from the desktop, and copy the scripts folder to the home directory. Then source the env.sh script to set up the working environment:
cp –r y:/EP/scripts ~
cd ~/scripts
source env.sh
- Class vowels in BKB sentences
- Your annotated bVd words and BKB sentences have been analysed for formant frequencies. You can look at the outcomes of the analysis by looking at the SFS files in y:/EP/bkb/yourname.
- Run a script to extract your own vowel formant frequencies from the recordings:
sml -ian -ifm vowelform.sml y:/EP/bkb/yourname/b*.sfs >vowelform.csv
- This creates the file c:/cygwin/home/B07_lab/scripts/vowelform.csv. Open this file in SPSS and using Graphs | Legacy Dialogs | Scatter/Dot create a scatter plot of vowel identity on axes F1 vs. F2 (For the best looking plot, choose to Label Cases by Vowel, and set Option to Display chart with case labels). Are the vowels in their expected positions? Compare your plot to a speaker of a different sex or a different accent. What differences do you observe?
- Run a script to collect un-normalised and normalised vowel formant frequencies from all speaker recordings of the bVd words and BKB sentences:
sh doallvowelform.sh >allvowelform.csv
- This creates the file c:/cygwin/home/B07_lab/scripts/allvowelform.csv with formant frequencies f1 & f2, and z-score normalised formant frequencies f1z & f2z. Use SPSS to create two scatter plots, one using the hertz values, one using z-scores. How well has the normalisation worked? What problems still arise?
- Run a script to measure the formant frequencies of the three close front vowels /iː, ɪ, i/ found in the bVd words and BKB sentence recordings (/i/ is the so-called "happy" vowel):
sh doallclosefront.sh >allclosefront.csv
- This creates the file c:/cygwin/home/B07_lab/scripts/allclosefront.csv. Read this into SPSS and plot a scatter graph of the 3 vowels against normalised formant frequencies to see how the vowels look on the F1-F2 plane.
- Using the normalised formant frequencies for the close front vowels for all speakers, use SPSS to test the hypothesis that /i/ (as in "happy") and /ɪ/ (as in "pink") have different formant frequencies. Do this first with two t-tests for f1z and f2z separately using Analyze | Compare Means | Independent samples T-test, with the formant frequencies as the test variables, and two groups specified by /i/ and /I/. Next, repeat for vowels /i/ and /iː/. What do you conclude about the status of the "happy" vowel /i/?
- You can now repeat one of your comparisons with a multivariate t-test called Hotelling's test that uses both formant frequencies in one comparison. First use Data | Select cases to select just the two vowels you want to compare, for example, select on the basis that If condition: vowel = "i" | vowel = "I". Next choose Analyze | General Linear Model | Multivariate, putting f1z and f2z as the Dependent variables, and vowel as a Fixed factor. In the output, look for the multivariate statistics and their significance. "Hotelling's trace" is a standardised measure of the Hotelling's T2 statistic.
- Multi-speaker vowel corpus
- For this exercise you need to enable UNICODE processing in SPSS. If this is not already enabled, start a new copy of SPSS and choose Edit | Options | Language and select Unicode for Character encoding.
- A corpus of F1 & F2 measurements of 11 English monophthongal vowels spoken by 44 speakers may be found in the file y:/EP/vowels-norm.csv. You will see columns corresponding to the speaker, vowel, F1 and F2, sex, first language, median F0, and speaker height. In addition the column F1H and F2H represent the formant frequency values scaled according to the speaker's height (as if all speakers were the same height). The columns F1Z and F2Z represent the formant frequency values scaled according to the mean and standard deviation of F1 and F2 for the speaker, then mapped back onto the average F1 and F2 means and standard deviations for all speakers.
- Load the vowels corpus into SPSS and explore the extent to which vowel formant frequencies vary with speaker height. For example you might plot a graph of F2 for /i:/ against height. You will need to select the /i:/ vowels first with Data | Select Cases. Compute a correlation coefficient using Analyze | Correlate | Bivariate for the F2 and Height variables, and interpret the result.
- Select all cases again. Compare a scatter plot of vowels using the raw F1 & F2 values against a scatter plot based on height-normalised values, and against a scatter plot based on z-score normalised values. Interpret the result.
- Test the hypothesis that vowels have an "intrinsic pitch", that is determine whether the F0 of vowels is affected by vowel category. First create a plot to show how F0MEDIAN changes with vowel and sex. Next use Analyze | General Linear Model | Univariate, with F0MEDIAN as the dependent variable, VOWEL and SPEAKER as Fixed factors. Under Model, select Main Effects only. Under Options, choose Parameter Estimates. What explanation might you find for the result?
Reflections
- What is the difference between /e/ and [e] ? Why do the symbols chosen for phonemes not always match the IPA chart?
- Give some examples of vowels changing in quality because of the context in which they occur.
- What is meant by "target undershoot" in vowel articulation? What would be the difference between "articulatory" targets and "acoustic" targets?
- Does vowel weakening in unstressed syllables occur as a consequence of fast speech, or are the weakened vowels stored in the mental lexicon?
- What difficulties does a child face when learning to copy adult vowel sounds?
Word count: . Last modified: 16:51 03-Feb-2018.