3. Measuring Voice Quality
Learning Objectives
- to learn about how changes in larynx settings cause changes in voice quality
- to understand the difference between subjective and objective measures of voice quality
- to gain experience in making Laryngograph recordings
- to learn about the form of Laryngograph signals
- to learn how different quantitative measures related to perceived quality can be extracted from speech and Laryngograph signals
- to experience the effect of changes in voice quality on major quantitative measures of regularity and breathiness.
- to appreciate some of the methodological problems associated with assessment of voice quality
Topics
- Why study voice quality?
The voice quality used by individuals is not constant but varies in different contexts. Voice quality can have both linguistic and para-linguistic functions: in making phonological choices in some languages, to supporting lexical tones, to aiding intonation, to marking dialogue acts (see Gobl & Ní Chasaide, 2010). Quantitative measures of voice quality could supplement the rating scales used to identify and monitor voice pathologies. Measurements of voice quality may help track changes in emotional or physiological state. Voice quality is important in the training of vocal performers, particularly actors and singers. There is still much to learn about the relationship between larynx settings and voice quality.
- Laryngeal Structures
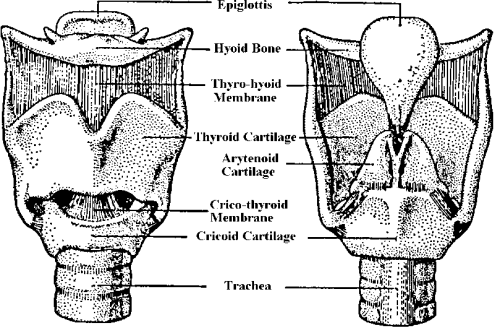
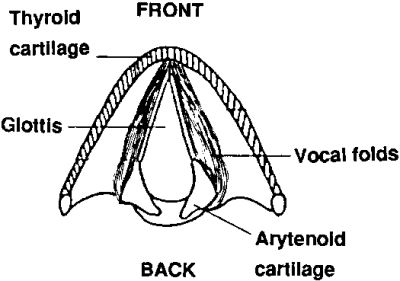
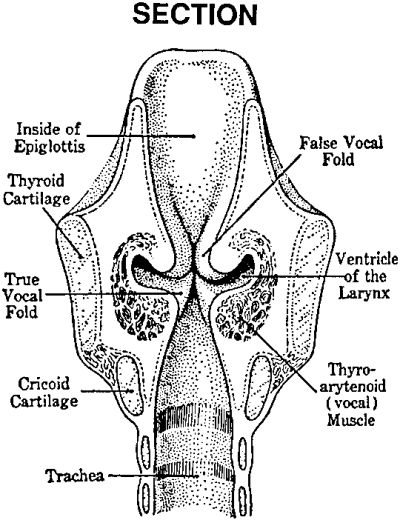
The important aspects of the anatomy of the larynx include the thyroid cartilage which surrounds and supports the vocal folds which are two muscular tissues joined at the front and separated at the back by attachment to the arytenoid cartilages. Through muscular control, the arytenoids can be swivelled to draw the vocal folds together across the top of the trachea, thereby closing off the air passageway from the lungs. The vocal folds can be changed in length and tension by movements of the arytenoid and thyroid cartilages, and the tension can also be varied by contracting the thyroarytenoid muscles that lay inside the folds. The gap between the vocal folds is called the glottis. The false vocal folds are fleshy structures above the vocal folds which do not normally take part in phonation.
Front/Back Views of Larynx
Superior View
Vertical section and air-flow schematic
- Laryngographic Analysis
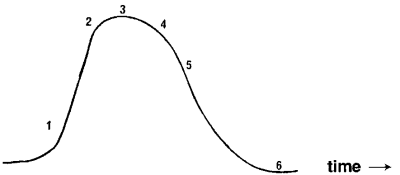
Because direct observation of vocal fold vibration is difficult and intrusive, we use an electrical means to get information about vocal fold movement. The Laryngograph (or Electroglottograph) is an instrument for measuring relative vocal fold contact area through the voicing cycle. Gold-plated guard ring electrodes are placed on either size of the thyroid cartilage, and a small electrical current is passed from one electrode to the other. The guard rings ensure that the current does not simply pass over the surface of the skin. When the vocal folds are closed, the impedance of the neck to the current flow is slightly reduced compared to the situation when the vocal folds are apart. The Laryngograph Waveform (Lx) shows how the current flow (contact area) changes with time. From the Lx waveform individual phonation cycles can be seen, and the individual phases of that cycle can be inferred.
Current Flow between Electrodes
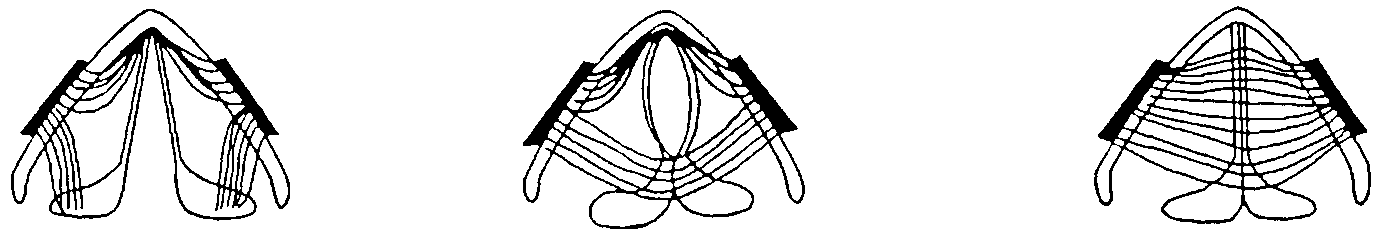
Stages in cycle of Vocal Fold Vibration
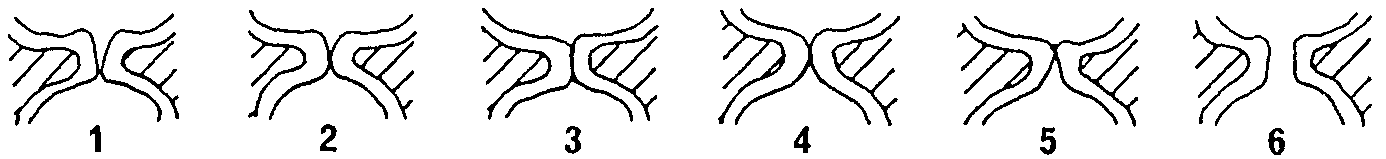
The Laryngograph current flow waveform
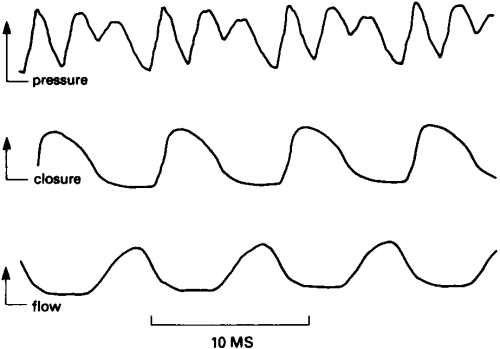
Speech Pressure, Lx and Flow Waveforms compared
Laryngograph terminology
Term Description Lx Laryngograph waveform, i.e. vocal fold contact area (or electrode current flow) against time. Tx Periods corresponding to individual glottal cycles Fx Instantaneous fundamental frequency (reciprocal of Tx) in hertz CQ Closed quotient, the percentage of the duration of each cycle when the folds are closed - Voice Qualities
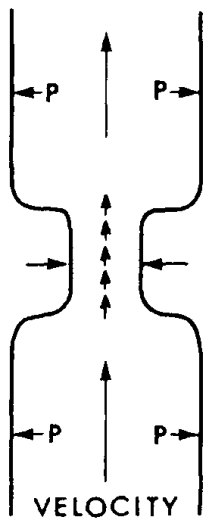
In Modal or normal voice quality, the vocal folds are approximated so that they completely cover the airway. They are also tensed to some degree which sets a fundamental frequency value toward the centre of the range for the speaker. Air from the lungs forces the folds apart and air flow builds up between them. There are two forces which pull the folds back to their central position: the natural elastic qualities of the folds themselves and the Bernoulli effect, which causes a reduction in pressure inside a constricted fluid flow. As these forces pull the folds together, the air flow increases in velocity which increases the reduction in pressure caused by the Bernoulli effect. Eventually the folds ‘snap’ together, cutting off the flow. This ‘snap’ causes a sudden reduction in pressure immediately above the folds, and it is this reduction which is the main source of energy for vocal tract excitation. Once closed, the cycle repeats; in modal voice the cycles are regular and the closures are complete.
In Breathy voice quality, the folds are not fully approximated so that complete closures do not occur. This has a number of consequences: firstly that air flow continues throughout the cycle which can lead to turbulence at the glottis, secondly that the closures are less sharp, and thirdly that the vocal folds remain open for a longer portion of the cycle.
In Creaky voice quality in contrast, the vocal folds are very tightly approximated which leads to low air-flow and cycles which are closed for a longer proportion of the cycle and which are irregular in duration. Creaky voice is commonly found at the bottom of a speaker’s pitch range when the folds are slack. A common form of creaky voice is called Diplophonia, where long and short cycles alternate.
In Falsetto voice quality, the vocal folds are extremely tense and are held in such a way as that only the internal edges of the vocal folds are involved in phonation. This means that the amplitude of phonation is small and of high fundamental frequency.
- Pitch epoch marking
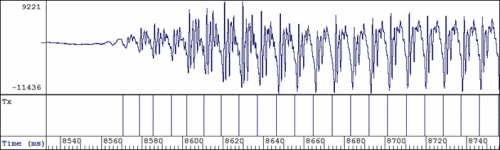
To estimate the regularity of vocal fold vibration it is useful to first delimit individual vocal fold cycles found in the speech signal. From these events, sometimes called "pitch epochs", it is possible to measure how adjacent cycles differ from one another. Epoch markers are relatively easy to find from the Laryngograph signal, but methods also exist for estimating these from the speech signal alone.
Tx Estimation from Lx
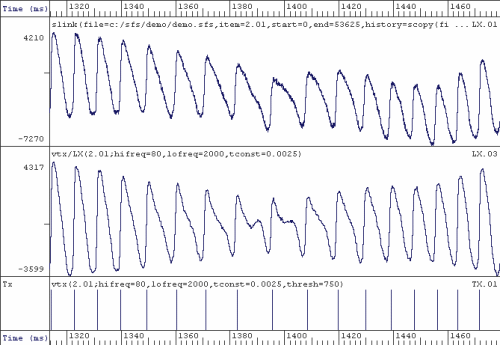
Tx Estimation from Speech
- Measures of regularity
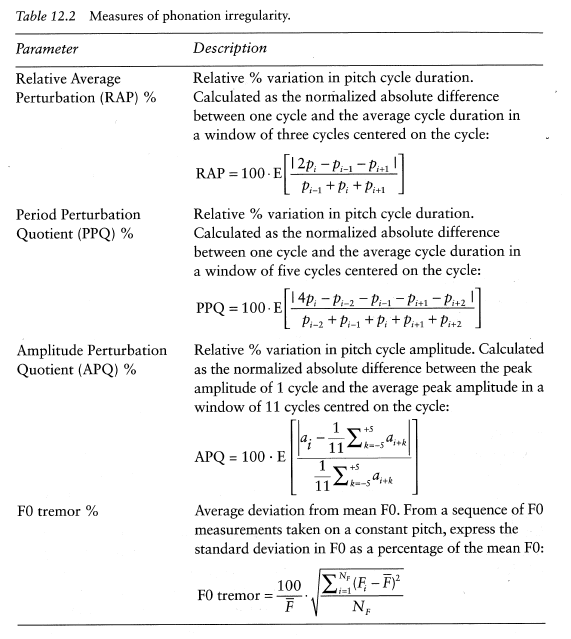
There are many possible statistics of voicing irregularity that can be estimated from the delimited vocal fold cycles. These focus on jitter (period perturbations), shimmer (amplitude perturbations) or tremor (longer-term F0 variability), some common ones are listed in the table below. In the formulae, the function E() is used to represent the "expected" or mean value of its argument. [from Huckvale, 2013]
- Measures of breathiness
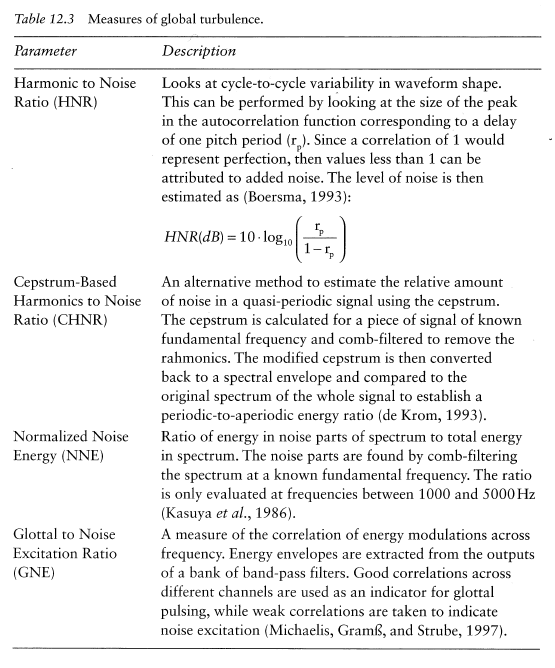
While differences in the duration or the strength of glottal cycles can be reasonably well assessed by measurements of durational or amplitude variability, it is harder to assess the amount of turbulent noise energy added to the signal during phonation. Such turbulence is commonly caused by inadequate or incomplete vocal fold adduction, such that the vocal folds do not fully close during vibration, and air leaks through the remaining gap, becoming turbulent in the process. This gives rise to a perceived "breathiness" in the voice. The measurement of added glottal turbulence is made more difficult by the presence of any other noises in the recording and by any irregularity of phonation frequency. Recordings are readily corrupted by broad-band noise generated by background noises such as computer fans or air-conditioning, or by the audio recording system itself. Acoustic measures may subsequently interpret this recording noise as glottal turbulence. Likewise, if the speech signal has an irregular phonation type, then the random variation in glottal cycle duration can also be a source of signal aperiodicity that can be confused with glottal turbulence by some measures. (Michaelis, Gramß, & Strube, 1997). The table below describes some popular measures of glottal turbulence: [from Huckvale, 2013]
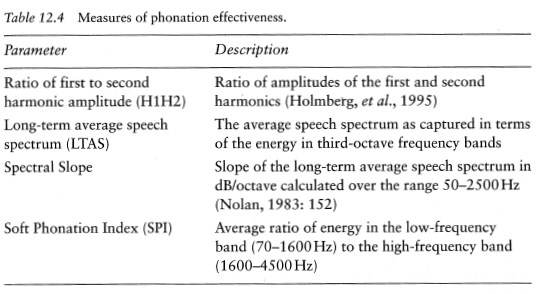
- Measures of Effectiveness
As well as irregularity and noisiness, a third characteristic of phonation type related to "effectiveness" of voice is sometimes estimated from the acoustic signal. The idea is to capture aspects of the voice related to how well it functions to carry phonetic information from speaker to hearer. These come down to creating a sound of sufficient intensity that has energy at a wide range of frequencies. Some example measures of spectral energy distribution are given in the table below. [from Huckvale, 2013]
- Voice Quality Instruments
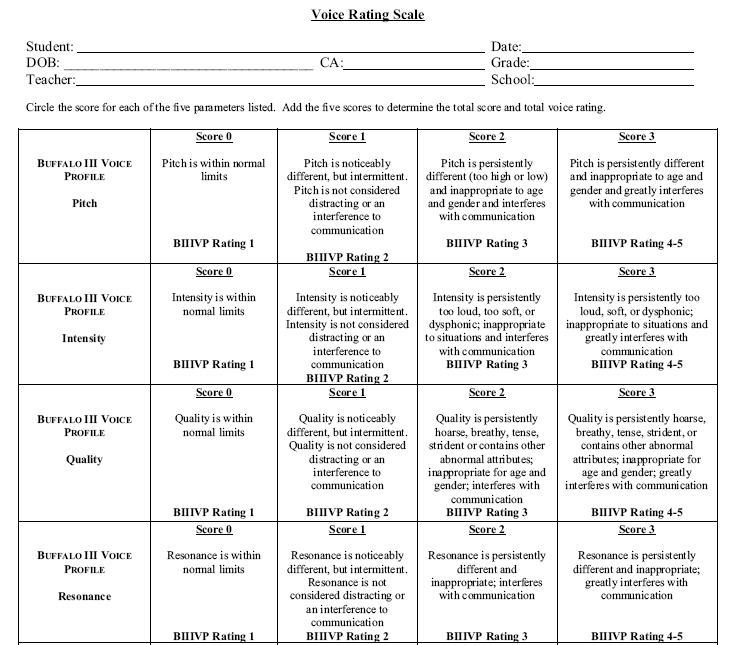
Clinical Rating
Buffalo III Voice Profile – Subjective Voice Quality Rating Scale
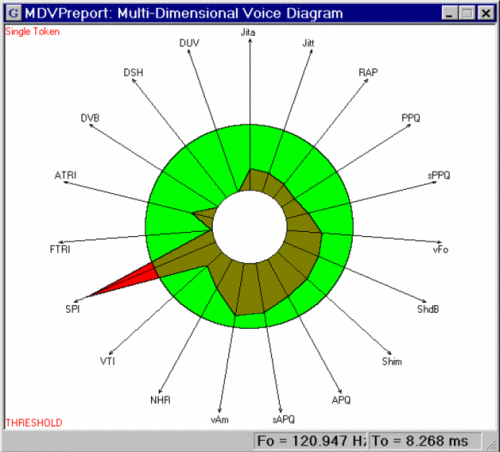
Commercial Tools
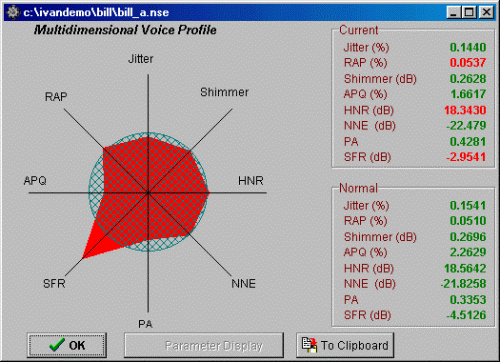
Kay Inc. - MVDP
Laryngograph Ltd
Avaaz Inc. - IVANS
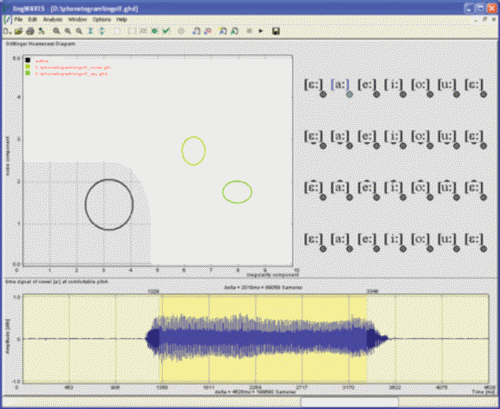
LingCom - Hoarseness Diagram
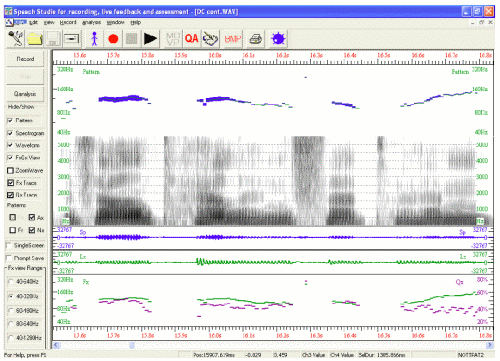
Speech Filing System (SFS)
File                            : C:\sfs\dev\arvowel.sfs
Speech Item                     : 1.01
Tx Item                         : 3.05
Voiced Duration (s)             : 1.94116
Mean F0 (Hz)                    : 120.547
Std-Dev F0 (Hz)                 : 7.21114
Jitter (RAP) (%)                : 0.472446
Jitter (PPQ) (%)                : 0.573014
Shimmer (APQ) (%)               : 3.92257
Harmonic/Noise Ratio (HNR) (dB) : 14.2744
Harmonics Ratio (H1H2) (dB)     : 9.355
Soft Phonation Index (SPI) (dB) : 18.8843
Praat:
-- Voice report for 1. Sound arvowel --
Date: Wed Jan 26 10:20:44 2011
Pitch:
   Median pitch: 119.177 Hz
   Mean pitch: 120.112 Hz
   Standard deviation: 3.844 Hz
   Minimum pitch: 116.214 Hz
   Maximum pitch: 142.062 Hz
Pulses:
   Number of pulses: 231
   Number of periods: 230
   Mean period: 8.331528E-3 seconds
   Standard deviation of period: 0.242306E-3 seconds
Voicing:
   Fraction of locally unvoiced frames: 4.000%   (8 / 200)
   Number of voice breaks: 0
   Degree of voice breaks: 0   (0 seconds / 1.999906 seconds)
Jitter:
   Jitter (local): 0.451%
   Jitter (local, absolute): 37.583E-6 seconds
   Jitter (rap): 0.186%
   Jitter (ppq5): 0.233%
   Jitter (ddp): 0.557%
Shimmer:
   Shimmer (local): 3.641%
   Shimmer (local, dB): 0.330 dB
   Shimmer (apq3): 1.714%
   Shimmer (apq5): 2.144%
   Shimmer (apq11): 3.357%
   Shimmer (dda): 5.141%
Harmonicity of the voiced parts only:
   Mean autocorrelation: 0.977159
   Mean noise-to-harmonics ratio: 0.024833
   Mean harmonics-to-noise ratio: 18.637 dB
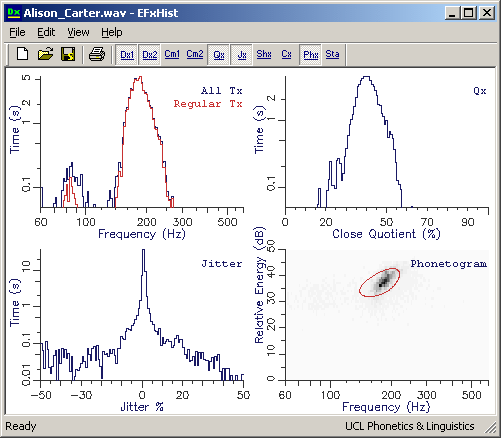
EFxHist
This is a windows program specifically for analysis of Speech and Lx recordings. Download link.
- Research Issues
We can identify areas worthy of further study:
- the large number of different measures being used is inconvenient and unnecessary, they are highly correlated with each other and over-describe the differences between qualities [they also seem unreliable, see Carding 2004]
- it is hard to relate the acoustic measures to larynx settings, this makes it hard to interpret the physiological causes of any changes in quality
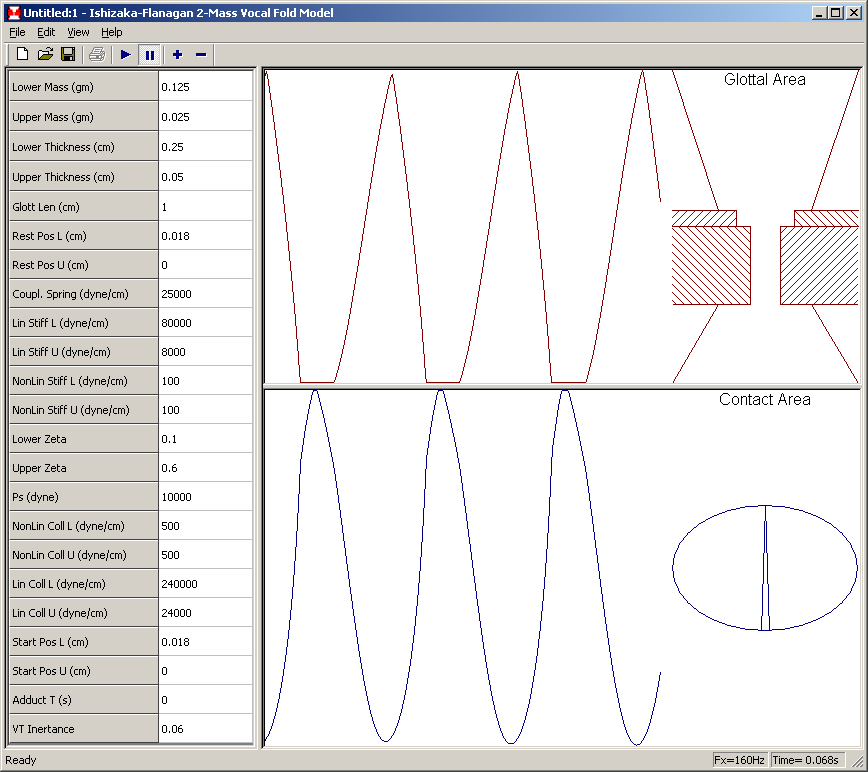
- existing computational models of larynx vibration don't (yet) seem to help interpreting the acoustic measures, possibly because of the complexity required to achieve a workable larynx simulation (Ishisaka & Flanagan, 1972, and more recent papers by Titze).
Implementation of a 2-mass model of vocal fold vibation. [Ishisaka & Flanagan, 1972, implemented by Ron Baken and Mark Huckvale]
- Parameters describing statistical distributions
Given a speech property that is measured over time (such as fundamental frequency, or jitter or HNR), there are a number of parameters that can be used to describe the distribution of that measured property collected from some recording.
Measures of central tendency
Term Description Mean Arithmetic average of values (i.e. sum divided by count) Median 50th percentile (i.e. half of data is lower than this value, half is higher) Mode Most common observed value (i.e. most frequently observed) Trimmed Mean Mean of values with outlier values removed (e.g. mean of the values falling between the 5th and 95th percentiles) Measures of spread
Term Description Standard deviation Square root of average squared distance to the mean IQR Inter-quartile range (i.e. distance between the 75th and the 25th percentailes) MAD Median Absolute Deviation (i.e. median of the absolute differences between values and the median) Measures of shape
Term Description Skewness Measure of the asymmetry of the distribution. Negative skew means that the left side of the distribution is longer, positive skew that the right side is longer. Kurtosis Measure of the "peakiness" of the distribution. A normal distribution has a kurtosis of 3. Smaller values have a more rounded peak and wider tails, while larger values have a more pronounced peak and more compact tails - Comparison of means across more than 2 samples
A t-test estimates the probability that two samples were drawn from the same underlying population, or in other words it can be used to estimate the probability that any difference in means between two samples could have arisen by chance if the null hypothesis were true.
The t-test does not easily generalise to more than 2 samples. Although one could perform multiple t-tests between each pair of 3 samples, you run the risk of a type I error (incorrect rejection of the null hypothesis) since the more tests you do the more likely one of them will give a rare result.
If all you need is a measure of the probability that N samples were drawn from the same population, you can use one-way analysis of variance. The diagram below makes this clear. Did the variation in sample means observed in 3 samples arise by chance, or were they drawn from 2 or more underlying populations with different means?
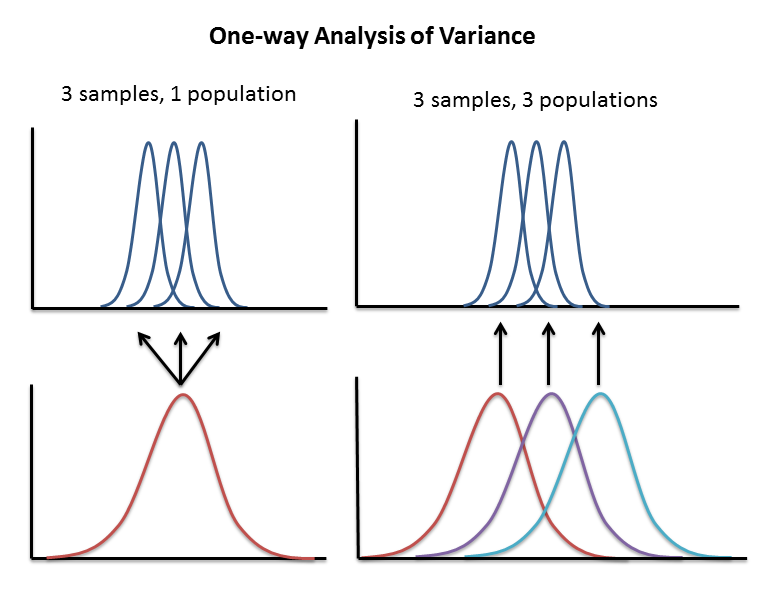
To decide between the two possibilities, the variances in the samples are analysed: both separately and together. The total variance in all the samples must be made up from two components: variation of the samples around the sample means and variation of the sample means around the overall mean. The ratio of these variances provides a measure of how well the separation into separate samples reduces the variance over the situation when all the samples are put together. This ratio of variances is measured using the "F-test" which estimates the probability that such a ratio could have occurred by chance if the null hypothesis is true.
Analysis of variance is an "omnibus" test in that even when it says that there is a difference between sample means, it doesn't tell us which ones are different or how many different underlying population groups exist. For that you need to perform "post-hoc" tests, which (safely) compare pairs of samples to show which possible groups of samples are supported by the data. A common post-hoc test is the Tukey Honest Significant Difference test.
References
- Gobl, C. and Ní Chasaide, A., "Voice source variation and its communicative functions", in William J. Hardcastle, John Laver and Fiona E. Gibbon (eds), The Handbook of Phonetic Sciences (Second Edition), Oxford, Blackwell, 2010, pp378 - 423,
- K.Ishizaka, J.L.Flanagan, “Synthesis of voiced sounds from a two-mass model of the vocal cords”, Bell Sys. Tech. J., Vol.51, 1972, pp.1233-1267.
Readings
- Abberton, Howard and Fourcin, Laryngographic assessment of normal voice: a tutorial. Clinical Linguistics and Phonetics, 3 (1989), 281-296. [On Moodle]
- P.Carding, et al, "The reliability and sensitivity to change of acoustic measures of voice quality", Clinical Otolarygology 29 (2004) 538-544. [On Moodle]
Laboratory Exercises
- Analysis of Phonation Types
- Record one-second samples of the vowel /ɑː/ with modal, breathy, creaky and falsetto voice qualities using both a microphone and a Laryngograph. Use SFSWin to record speech and Lx at 44100 samp/sec.
- Choose Tools|Interactive Voice Analysis to start the EFxHist program. Record the following VQ parameters for each voice quality.
- Enter your numbers into the Data Entry form (see Moodle page) so that values are collected for each member of the class. Once all the measurements are made, the class results will be made available in the file y:/EP/vqanal.csv. Open this in SPSS.
- Using Graphs | Legacy Dialogs | Boxplot, plot graphs showing how each VQ parameter varies for the different voice qualities across speakers. Which measures seem most robust in discriminating the phonation types (i.e. have largest change but smallest variance)?
- Using Transform | Automatic recode, convert the QUALITY string variable into a multiple level factor VQUALITY.
- Using Analyze | Compare Means | One way ANOVA, find support for your conclusions about the most useful VQ parameters through an analysis of variance test. Set the Dependent list to some or all of the parameters and the Factor to VQUALITY. Under Post Hoc, choose Tukey. Under Options, choose Descriptives.
- Interpret the outcomes of the analysis in terms of the utility of the VQ parameters.
- VQ Measures and Simulated Emotion
- The Berlin Database of Emotional Speech is a corpus of sentences spoken by 10 actors under simulated emotions.
- Each sentence has been analysed using SFS and summary statistics for F0, irregularity and breathiness have been stored in y:/EP/emotion.csv, as follows:
- Open the emotions analysis file in SPSS. Using Graphs | Legacy Dialogs | Boxplots, explore the different VQ parameters as a function of the simulated emotion class. Which measures give the most discrimination? What differences do you observe between the un-normalised and normalised versions of each parameter?
- (If you have time) Using Analyze | Classify | Tree, test the performance of a Classification and Regression tree on predicting the the EMOTION label (dependent variable) from the VQ parameters (independent variables). Under Validation, choose Cross-validation. Under Criteria, set the Minimum number of cases for Parent nodes to be 50 and Child nodes to be 25.
- Look at the tree to find the most useful VQ parameters for classification.
- Look at the confusion matrix to determine which emotions are best recognised. Can you explain the outcomes?
| Fundamental Frequency (Hz) | Vocal fold vibration repetition frequency |
| Closed Quotient (%) | % of time vocal folds are closed in each cycle |
| Jitter (%) | % change in cycle duration between cycles |
| Shimmer (%) | % change in speech amplitude between cycles |
| HNR (Harmonic-to-noise ratio) (dB) | Ratio of size of periodic component to size of aperiodic component in speech signal |
| F0MEAN | Mean F0 (Hz) |
| F0SD | Standard deviation of F0 (Hz) |
| PPQ | Jitter (%) |
| APQ | Shimmer (%) |
| HNR | Harmonic to Noise Ratio (dB) |
| SPI | Soft Phonation Index (dB) |
Additionally each VQ parameter has been normalised to the range found from all recordings for that speaker - these parameters have the measure name ending in "Z" (for z-score).
Reflections
- List some ways in which laryngeal adjustments/gestures are used linguistically (that is to help encode messages)
- What anatomical structures are involved in changing phonation type?
- What are the advantages and disadvantages of using a Laryngograph to estimate voice quality parameters?
- What are the advantages and disadvantages of using measures like jitter and shimmer which depend on pitch epoch marking?
- How might you go about designing a study to see how voice quality changed in different situations, as a function of fatigue for example?
Word count: . Last modified: 10:27 23-Jan-2018.